Recommended
Summary
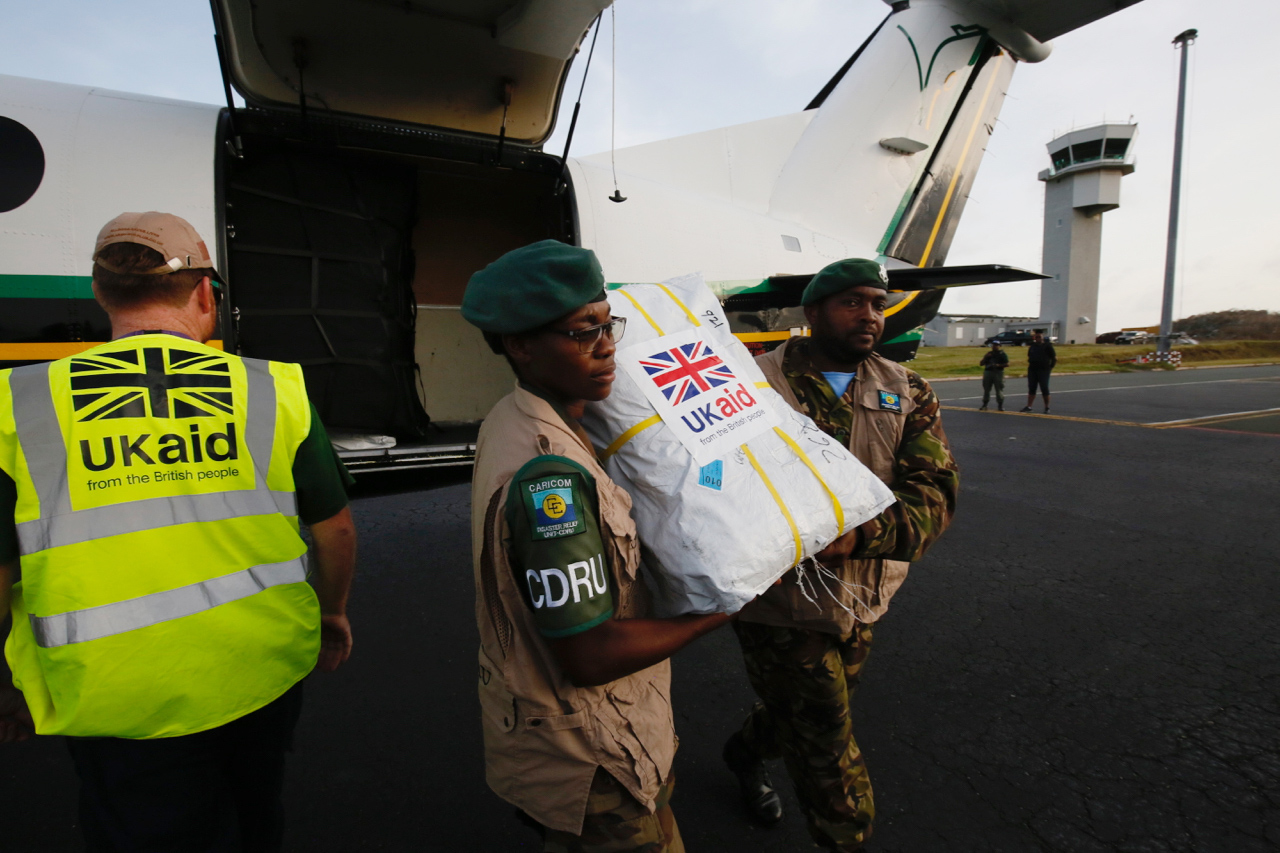
This note highlights a number of relevant figures in relation to the proposed reduction of the UK aid budget from 0.7 percent to 0.5 percent of gross national income (GNI) and looks at potential impacts.
Size and pace of proposed reduction
- The move to 0.5 percent and lower GNI will reduce UK aid by £4.5bn, or 30 percent relative to 2019
- The reduction from 2020 to 2021 of £4.1bn (25 percent) was announced two months before the year began, whereas the growth from 0.5 percent to 0.7 percent took four years (the increase from £10bn to £15bn took six years)
Wider UK international spend
- Outside of aid, international spend through the EU (£8.6bn net in 2020) will fall from 0.4 percent of GNI to near zero by 2025
- The government’s defence spending, at 2.1 percent of GDP in 2019[1] (above the 2 percent NATO target) will rise by £6bn per year by 2021, to over 2.4 percent of GDP
Fiscal situation
The chancellor said that the UK aid budget would return to 0.7 percent of GNI “when the fiscal situation allows.”
- The Office of Budget Responsibility (OBR) expects the economy to return to its 2019 size by 2022
- On current government plans, the “current deficit” is expected to return to near 2019 levels in 2025
- The saving of £4.3bn is very small relative to UK debt. If maintained for five years, the savings would reduce debt levels by less than 1 percent
- Despite the rise in debt, the UK’s annual interest payments have fallen—from 1.7 percent of the economy in 19/20 to under 1 percent in the coming period
G7 and G20 comparisons
- France and Germany both plan to provide over 0.5 percent of GNI in aid next year
- At least four G7 members plan to increase the absolute amount of aid in 2021
- The UK’s debt as a share of GDP is third lowest in the G7 (and below the US)
- The foreign secretary incorrectly suggested 0.5 percent would put the UK second in G20 for aid as a share of GNI—it would also be below Saudi Arabia and Turkey (the EU is also in the G20, and four of its members are above that level)
Potential impacts
It is not yet clear which programmes will be cut in 2020 or 2021. However, a cut of a 30 percent will have a major impact:
- If plans on aid spending for climate, refugee costs, EU payments, and other areas (see below) are maintained, then remaining bilateral aid will need to fall by over 50 percent
The spending review has set an aid budget of £10bn for 2021. Looking at 2012-13 when UK aid was last at this level, we could expect:
- Spend on the 46 least developed countries to fall by £1.2bn
- Humanitarian spending to be £0.9bn lower; health spending to be £0.3bn lower
Finally, we undertake a very simple illustration of the potential impacts which scale down the government’s own reported aid results. If the government cuts lower-impact programmes, these may overstate the impacts, but conversely, if cuts are steeper, or on higher impact programmes that are easier to cut quickly, they may be higher. A 30 percent reduction in results would include (but not be limited to):
- 5.3 million fewer children a year immunised, resulting in 100,000 fewer lives saved each year
- 4.5 million fewer children a year gaining a decent education
Introduction
This note looks at the size and impact of the government’s plan to reduce aid (official development assistance, ODA) to 0.5 percent of the economy (gross national income, GNI) in 2021.
After looking at the likely size of the reductions and implied budget, it compares this with the UK’s other areas of international spend, and plans in the G7 and G20. It looks at the fiscal circumstances of the UK and concludes with some potential impacts of the planned reduction.
For forward plans, it uses the November update of the Office of Budget Responsibility (OBR) projections of GNI and other fiscal aggregates.
Government aid plans and projected GNI
The UK’s ODA budget is projected in table 1.
Table 1. Expected UK ODA budget and comparisons
| Year | ODA budget (£bn) | Change in 2021 | ||
|---|---|---|---|---|
| Annual | Compared to 2019 | Compared to 0.7% of GNI | ||
| 2019 | 15.2 | |||
| 2020 | 14.3 | |||
| 2021 | 10.7 | -4.1 (25%) |
-4.5 (30%) |
-4.3 (29%) |
Notes: This table uses OBR estimates and projections of GNI to estimate ODA at 0.7% in 2020 and 0.5% in 2021. The spending review suggested a 2021 budget of only £10bn. Figures may not sum due to rounding.
The figure in 2020 is not confirmed. The government had previously identified £2.9bn of reductions which, if implemented, would mean an aid budget of £12.3bn in 2020 and amount to 0.6 percent of GNI.
In 2021, the ODA budget will be £4.3bn/year smaller under 0.5 percent (29 percent reduction) than under 0.7 percent.
Steepness of the decline and commitments
It took four years for the ODA budget to grow from 0.5 percent in 2009 to 0.7 percent in 2013. To get from £10bn to £15bn, it took six years (2013, £11.4bn to £15.2bn in 2019).
The 2021 reduction (of at least £4.3bn vs 2020, or 30 percent) was announced in November, less than two months before it took effect in January 2021.
The UK has already made significant commitments in this period, meaning that cuts will be strongly concentrated in uncommitted areas, including bilateral aid.
Some known commitments in 2021:
- EU ODA (~£1.2bn)
- Climate (~£2.3bn based on annualising five-year commitment)
- CDC (declared budget of £782m for 2021)
- Global Fund (declared budget of £440m for 2021)
In addition to these amounts, the UK’s contribution to the World Bank (IDA) will be £1 billion on average over the next few years. In-donor refugee costs averaged around £400 million between 2016 and 2019, and in-donor administration costs were above £500 million per year in the last three years. Both are costs that may be difficult to reduce significantly in a short time frame.
If these existing commitments are maintained, and assuming there is no re-profiling between years,[2] these account for over 6.6bn, leaving £3.5bn for bilateral and other aims. This is substantially below the bilateral spend of £6.1bn spent the last time the UK had a £10bn aid budget (see section below), and would be a 60 percent reduction on the 2019 bilateral aid budget.
When will the fiscal situation allow a return to 0.7 percent?
The government has said it will return to the 0.7 percent “when the fiscal situation allows.”[3] In terms of the economy, the OBR expects the UK economy to return to its 2019 size in Q4 2022.[4]
The government’s main fiscal measure uses the current budget—this compares tax receipts with non-investment spending. OBR projections are based on current policy, which may be unduly pessimistic given the absence of tax or other spending reductions. Still, in 2019/20 the current budget deficit was 0.6 percent of GDP or—looking at the period in which the 0.7 percent target was met (from 2013)—the deficit was at or under 5 percent. The OBR expects the current deficit to fall under 5 percent in 2021-22, and for it to fall to 1 percent by 2025/26.
Figure 1. Current budget deficit (% GDP)
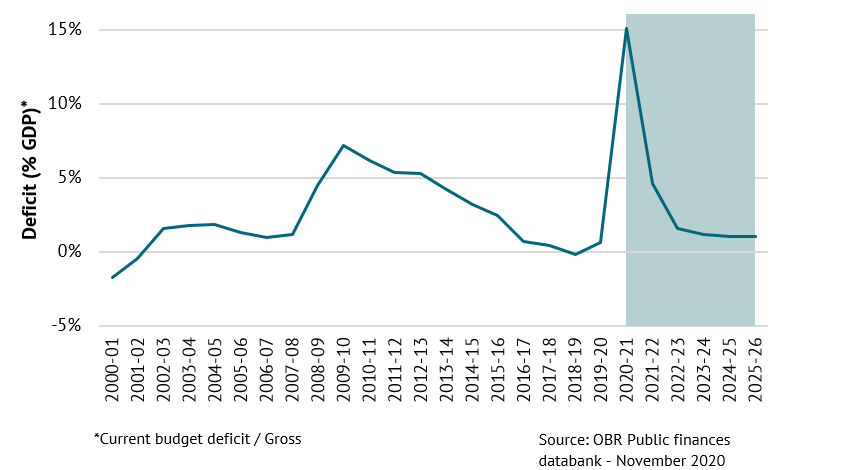
In terms of debt, the OBR expects this to be £2,478bn in 2021/22. The 2021 saving of moving to 0.5 percent is expected to be just under £4.3bn. If we take five years of this annual saving, it would equate to 0.9 percent of this debt.
Even as the UK’s stock of debt rises, the cost of servicing this debt is forecast to remain at historic lows up to 2025/26. The OBR projects that central government debt interest will comprise less than 1 percent of GDP over the period of the Spending Review, below its (19/20) pre-COVID level of 1.7 percent.[5]
Other G7 country debt levels and aid plans
In each of years 2020 and 2021, the UK is expected to have the third-lowest debt among G7 countries, relative to the size of its economy. Each of the three countries with larger debt than the UK (France, Italy and Japan) have stated their intention to increase their ODA/GNI ratio in 2021. However, France is the only country of these three to overtake the UK in terms of this ratio.
Table 2. G7 Debt as % of GDP projection, and ODA plans

Sources: Debt figures from IMF WEO (Oct 2020). ODA plans from donor tracker other than for France & UK
Comparison of £10bn vs £15bn aid budget
The government’s proposed 2021 aid budget is likely to be around £10bn (from £15bn in 2019). We look at the last time it was at this level to consider how spending areas could be affected. Over 2012 and 2013, the UK’s aid budget averaged £10.1bn.[6] Looking at how ODA was allocated across this period provides some context to assess UK aid allocation post-cuts. Table 3 compares the historic £10bn budget with 2019’s £15bn budget.
Table 3. UK aid allocation under a £10bn & £15bn ODA budget
| Aid Allocation | UK ODA Budget (£bn) | Change (£bn) | |
|---|---|---|---|
| ~£10bn* | ~£15bn** | ||
| Bilateral ODA of which: |
6.1 | 10.3 | 4.1 |
| LDCs | 3.8 | 5.0 | 1.2 |
| Health | 1.2 | 1.4 | 0.3 |
| Education | 0.8 | 0.8 | 0.0 |
| Economic infrastructure & services | 0.5 | 1.2 | 0.7 |
| Humanitarian | 0.6 | 1.5 | 0.9 |
*Based on ODA allocation averaged across 2012 & 2013, when the ODA budget was £8.8bn and £11.4bn respectively.
**Based on ODA allocation in 2019, when the ODA budget was £15.2bn.
Source: UK ONS Statistics on International Development
Bilateral ODA—provided directly to partner countries—accounted for about £6.1bn of the previous £10bn budget, some £4.1bn less than its allocation in 2019.
It may be difficult for the government to revert to its 2012-13 bilateral budget allocation given amounts now allocated to climate, R&D, conflict, and other commitments (see above). However, if it does, there would be substantial cuts (of £1.2bn) to the poorest countries (LDCs) and to health (£0.3bn) and humanitarian aid (£0.9bn).
Impacts of cuts by sector
The government has not yet provided any information on the cuts to be made in 2020 or 2021. However, we have drawn on government reported results for 2015-20[7] to undertake a simple illustration of potential impacts.[8] We have some reservations about whether these figures are a reliable guide to the direct impact of UK aid. Still, as the government has claimed these results, it seems reasonable to use them as an indication of the impact of cuts.
We estimate annual impacts based on the results claimed over the 2015-20 period. Assuming a linear relationship between spending and results, if the budget for each programme targeting the below sectors falls by 29 percent (due to the fall in the ODA budget from 0.7 percent to 0.5% percent of GNI), this would imply the foregone development impacts shown in table 4.
Table 4. Potential impact of ODA cuts based on DFID results claims
| Sector | Annual Development Impact Foregone due to ODA Budget cut from 0.7% to 0.5% of GNI* |
||
|---|---|---|---|
| Education | 4.5 million | fewer children supported to gain a decent education | |
| WASH | 3.6 million | fewer people supported to have sustainable access to clean water and/or sanitation | |
| Nutrition | 15.7 million | fewer children under 5, women of childbearing age or adolescent girls reached through nutrition-related interventions | |
| Immunisation & lives saved | 100,000 | fewer lives saved by immunising children against killer diseases | |
| 5.3 million | fewer children immunised against preventable diseases | ||
| Family planning | 7.2 million | fewer women/girls supported to use modern methods of family planning | |
| Humanitarian | 1.9 million | fewer people reached with humanitarian assistance (food aid, cash and voucher transfers) | |
| Neglected tropical diseases | 15.8 million | fewer people receiving treatment or care for one or more neglected tropical diseases | |
| Jobs & income | 290,000 | fewer people supported to have raised incomes and better jobs or livelihoods | |
| Energy | 44 | fewer megawatts of clean energy capacity installed | |
*Assuming that all aid programmes are cut by an equal proportion (29%=(0.7%-0.5%)/0.7%); that programmes currently achieve their average annual results claimed between 2015-20; and that there is a linear relationship between spending and results achieved.
Source: CGD analysis of DFID Results Estimates 2015 to 2020: Tables
The calculations behind these estimates are laid out in Annex A.
These are results averaged across all relevant programmes. The government may be successful in cutting weaker performing programmes, in which case these figures likely overstate the impacts. Still, given the short time frame for the cuts, it is also possible that those programmes that are easier to cut quickly could be higher performing, in which case these figures would understate the impacts.
Finally, the government could try to protect these budget-lines—but, as the section above illustrates, existing commitments to the EU, CDC, climate, and other costs within the UK make up a significant portion of the aid budget.
Conclusion
The move to cut aid from 0.5 to 0.7 percent of the economy in a single year would mean a substantial cut to the UK’s aid budget of £5bn, and 30 percent relative to 2019.
Most of the UK’s peers are stepping up their aid commitments in recognition of the impact of COVID-19 and the poorest countries’ inability to borrow as developed nations have.
If the UK government goes ahead, it will be a very steep reduction in its aid budget, most of which will need to be applied within the year, leading to value-for-money risks. Given the UK’s focus on the poorest countries and issues, the cut would also mean a substantial reduction in support to the least developed countries, and the government’s own results suggest hundreds of thousands of lives will not be saved.
Annex A. Breakdown of estimated potential impact of ODA cuts based on DFID results claims
This table summaries results reported by DFID between 2015 and 2020, adjusts them to an annual figure; and then scales that figure by the proposed budget reduction.
| Sector | Indicator | Indicator Type | Period | Results Claimed | Annualised Results | Annual Development Impact Foregone due to ODA Budget cut from 0.7% to 0.5% of GNI[9] | |
|---|---|---|---|---|---|---|---|
| Education | Number of children supported to gain a decent education by DFID | Peak year | April 2015 to March 2020 | 15,600,000 | 15,600,000 | 4,457,143 | fewer children supported to gain a decent education |
| WASH | Number of people with sustainable access to clean water and/or sanitation through DFID support | Cumulative | April 2015 to March 2020 | 62,600,000 | 12,520,000 | 3,577,143 | fewer people supported to have sustainable access to clean water and/or sanitation |
| Nutrition | Number of children under 5, women of childbearing age and adolescent girls reached by DFID through nutrition-related interventions | Peak year | April 2015 to March 2020 | 55,100,000 | 55,100,000 | 15,742,857 | fewer children under 5, women of childbearing age or adolescent girls reached through nutrition-related interventions |
| Immunisation & Lives Saved | Number of lives saved by immunising children against killer diseases | Cumulative | January 2015 to December 2018 | 1,450,000 | 362,500 | 103,571 | fewer lives saved by immunising children against killer diseases |
| Number of children immunised against preventable diseases | Cumulative | January 2015 to December 2018 | 74,310,000 | 18,577,500 | 5,307,857 | fewer children immunised against preventable diseases | |
| Family Planning | Number of women and girls using modern methods of family planning through DFID support (Total Users) | Average | April 2015 to March 2020 | 25,300,000 | 25,300,000 | 7,228,571 | fewer women/girls supported to use modern methods of family planning |
| Humanitarian | Number of people reached with humanitarian assistance (food aid, cash and voucher transfers) through DFID support | Cumulative | April 2015 to March 2020 | 33,700,000 | 6,740,000 | 1,925,714 | fewer people reached with humanitarian assistance (food aid, cash and voucher transfers) |
| Neglected tropical diseases | Number of people receiving treatment or care for one or more neglected tropical diseases | Cumulative | 2017 to 2019 | 166,100,000 | 55,366,667 | 15,819,048 | fewer people receiving treatment or care for one or more neglected tropical diseases |
| Jobs & Income | Number of people supported to have raised incomes and better jobs or livelihoods | Cumulative | April 2015 to March 2020 | 5,000,000 | 1,000,000 | 285,714 | fewer people supported to have raised incomes and better jobs or livelihoods |
| Energy | Megawatts of clean energy capacity installed | Cumulative | April 2015 to March 2020 | 770 | 154 | 44 | fewer megawatts of clean energy capacity installed |
[1] The NATO target is expressed in GDP rather than GNI, which is used elsewhere in this note. GDP is marginally higher than GNI across the period, so defence spending would be almost 2.5 percent of GNI in 2021.
[2] Re-profiling means adjusting the timing of multiyear commitments. Still, with a shrinking budget, putting these commitments back will mean a steeper reduction in the remaining budget in future years.
[3] HM Treasury (November 2020) Spending Review 2020, Paragraph 6.48, p.70
[4] See Chart 1.2 of OBR November 2020 Economic and fiscal outlook – charts and tables: Executive summary https://obr.uk/efo/economic-and-fiscal-outlook-november-2020/
[5] Calculated as central government debt interest, net of APF / gross domestic product.
OBR Public finances databank - November 2020; Available at: https://obr.uk/data/
[6] In 2012, ODA was below this level, at £8.8bn; and in 2013 it was above this level, at £11.4bn.
[7] DFID Results Estimates 2015-20: Sector Report, https://assets.publishing.service.gov.uk/government/uploads/system/uploads/attachment_data/file/927493/dfid-results-estimates-sector--report-2015-2020-update-16oct20.pdf
[8] We’re grateful to analysts at the ONE campaign for suggesting this approach
[9] Assuming that all aid programmes are cut by an equal proportion (29%=(0.7%-0.5%)/0.7%); that programmes currently achieve their average annual results claimed between 2015-20; and that there is a linear relationship between spending and results achieved.
Rights & Permissions
You may use and disseminate CGD’s publications under these conditions.