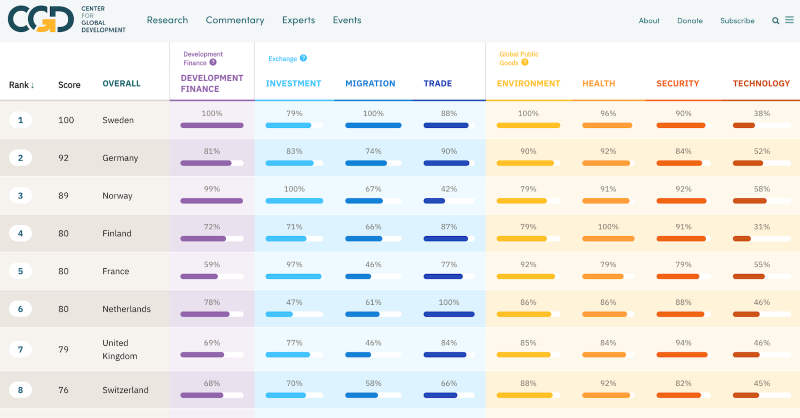
The UK Government has committed to producing a strategy on how the UK will support local leadership on development, climate, nature and humanitarian action; and its Foreign, Commonwealth and Development Office has endorsed a Donor Statement on Supporting Locally Led Development. Lisa Nandy, Labour’s shadow development minister, has also said that her approach would “empower people in their own countries”, with “a strong emphasis on localism and civil society.” This is an important agenda that is finally getting the attention it deserves.
Our assessment of the quality of UK aid has long identified its weakness in the level of "ownership” recipients have. In this blog, we highlight three strands of evidence that suggests the UK has a poor and worsening record on empowering and partnering with recipient countries. Despite UK aid being officially “untied”, a very high proportion of contracts are awarded to UK-based organisations. While these measures are only part of the story, they point to the scale of the challenge and that any strategy should tackle. Below we collate evidence from delivery channels, contract awards, and recipient surveys.
Half of bilateral aid is spent in the UK…
For aid to be locally-led, an obvious condition is that it must be spent within recipient countries. Yet this is not the case for a significant and rising share of UK aid, which is being spent domestically to support refugees, asylum seekers and international students residing within its own borders; administration; and research conducted by UK institutions.
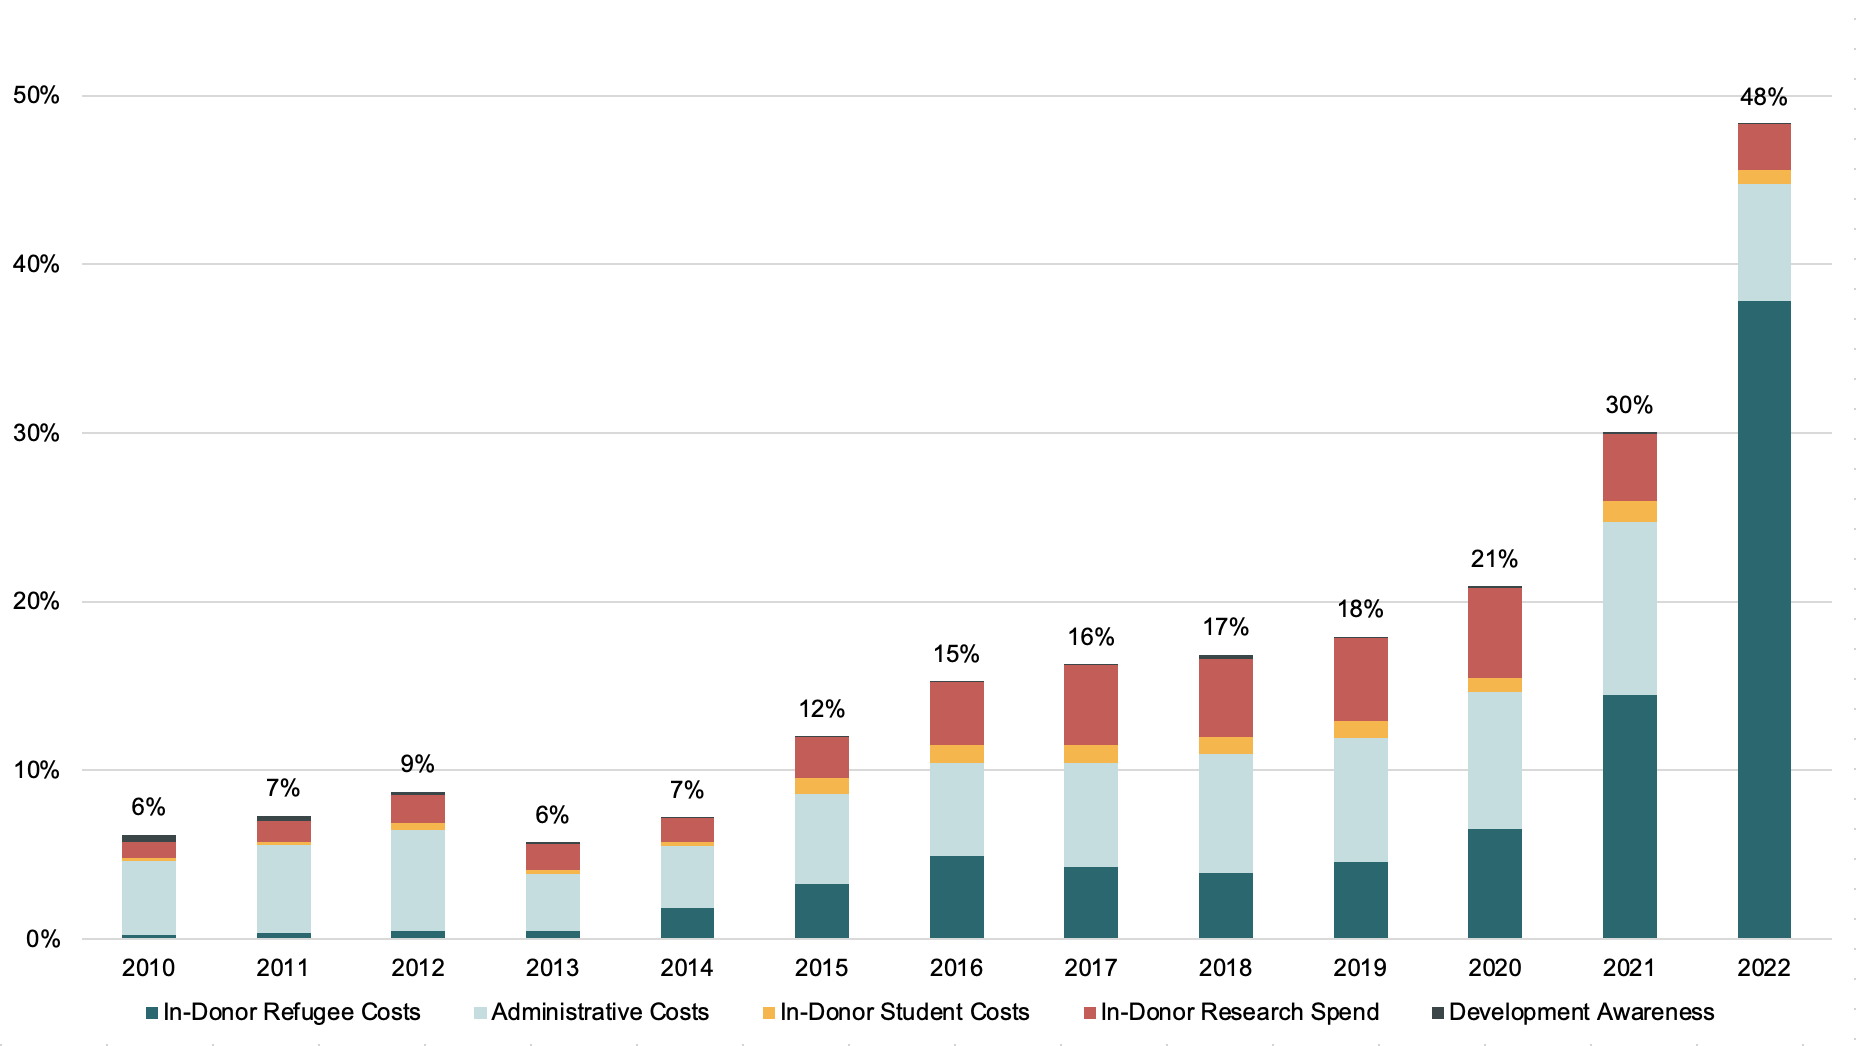
In fact, over the last decade, every year has seen the UK spend a greater share of its bilateral aid within its own borders: rising from a low of 6 percent in 2013, to an unprecedented 48 percent in 2022. In-UK refugee costs are well-known to have driven the recent spike, and comprise the most significant pressure. But an increase in the UK share of the bilateral aid budget can be seen even before 2021, and even when excluding refugee costs. For instance, the share spent on administration doubled between 2013 and 2022 (now 7 percent of the bilateral total), whilst it rose by almost three-quarters for research (to 2.7 percent), and more than tripled for students (to 0.8 percent).
Figure 1: Share of UK Bilateral ODA Gross Disbursements Spent within the UK*
Source: OECD CRS
*Note: In-donor bilateral ODA spend is defined as five elements (based on CRS codes for purpose, aid type, and delivery channel): in-donor refugee costs (purpose codes: 93010, 93011, 93012, 93013, 93014, 93015, 93016, 93017, 93018; aid type codes: H02, H03, H04, H05), in-donor student costs (aid type codes: E01, E02), administrative costs (purpose code: 91010; aid type code: G01), development awareness (purpose code: 99820; aid type code: H01), and in-donor research spend (defined as spend reported with (a) an unspecified recipient; (b) a research-related purpose code (43082, 11182, 12182, 12382, 23182, 31182, 31282, 31382, 32182, 41082); and (c) a donor-based parent channel code (11000, 22000, 61000) or a non-specific research institute as a channel code (51000)).
Provisional statistics for 2023 show that in-UK refugee costs rose to £4.3bn. Along with conservative assumptions on other in-UK spend we estimate that over half of the UK's bilateral aid was spent within the UK in 2023. Details on other in-UK spend are not yet available for 2023 (i.e. for admin, research, students, and development awareness), but these were just over £1bn in 2022 (and were also above £1bn in each of the preceding six years). If they remained at £1bn, then 54 percent of the UK’s bilateral aid was spent within the UK in 2023. And even if these other costs fell by a third, the UK would still have spent over half of its bilateral aid within the UK (these other in-UK costs rose in every year from 2010 to 2020; they fell in 2021 and 2022 by 19 and 8 per cent respectively).
…Of the rest, seven times more is channelled through UK-based organisations than those in recipient countries
As part of reporting on Official Development Assistance (ODA) to the OECD, providers report the delivery channels used, which record “the first implementing partner” of an aid project, usually with contractual responsibilities. Our colleagues—Euan Ritchie, Charles Kenny, Ranil Dissanayake, and Justin Sandefur—have previously made use of this data to estimate levels of local ownership, by looking at the share of aid channelled through donor- or recipient-based organisations. They found that in 2020 the UK—along with countries like the US, Canada and the Netherlands—channelled more aid through organisations based in their own countries than those based in recipient countries; whereas Japan and France made greater use of recipient-based organisations.
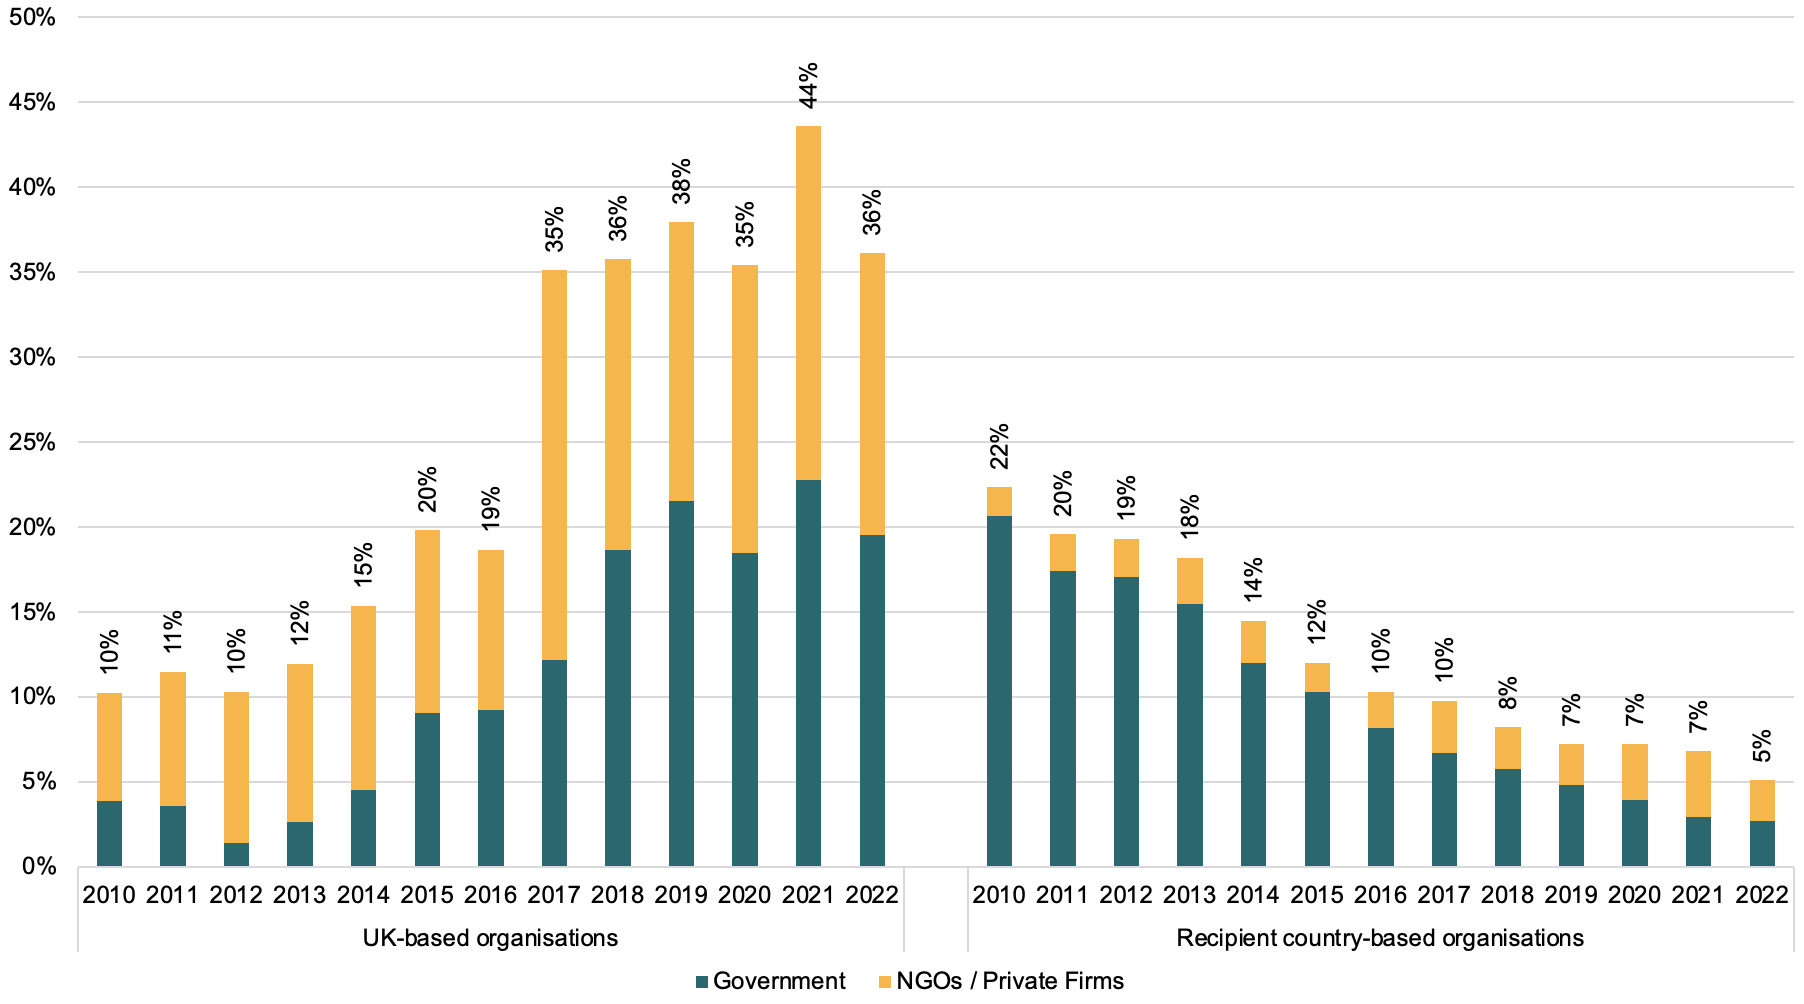
Figure 2 below follows their method, but highlights the trends for UK aid up to the latest 2022 data, and excludes the in-UK spend shown in Figure 1. The results are stark. Even for the UK’s bilateral aid spent abroad, just 5 percent in 2022 was channelled through recipient governments, NGOs or private firms. By contrast, 36 percent was spent through the equivalent UK-based organisations. On both metrics, this compares unfavourably with total ODA flows from all donors, of which 32 percent was channelled through recipient-based organisations and 32 percent through donor-based organisations in 2020.
Figure 2: Share of UK Bilateral ODA Gross Disbursements (Excluding In-UK Spend*) Channelled through UK- or Recipient-Based Organisations, 2010-22
Source: OECD CRS
*Note: i.e. Excluding in-donor spend shown in Figure 1 (in-donor refugee costs, in-donor student costs, administrative costs, development awareness, and in-donor research spend).
Of course, much of the funding that UK organisations receive is ultimately spent in partner countries (though we are not aware of data on this). However, our analysis also reveals a rise in spend with UK-based organisations over the past decade. This may in part relate to the shifts in the type of spending undertaken—for example, the balance between in-country programmes and those which are centrally managed (which have grown).
In 2010, the share of UK bilateral aid (excluding that spent within the UK) channelled through recipient-based organisations (22 percent) was more than double the share channelled through UK-based organisations (10 percent)—the remainder being channelled through third country governments or private firms, international NGOs, multilateral organisations, or else through other channels lacking information on residence. By 2022, seven times as much aid was being channelled through UK-based organisations (36 percent) as through recipient-based organisations (5 percent). And whilst the share channelled through UK-based organisation has more than tripled since 2010, the share channelled through recipient-based organisations has fallen to under a quarter of its original level.
Interestingly, the decline in the recipient-based share of bilateral aid is entirely due to a reduction in government channels. Over the period UK bilateral aid provided as “general budget support” (i.e. direct support for governments’ spend) fell, from over 8 percent in 2010 to zero in 2022 (see SID Table A7). When it comes to NGOs and private firms, the finance channelled through recipient-based organisations has always been a fraction of that channelled through UK-based organisations.
Hence, we see that not only has the share of UK bilateral aid actually spent in recipient countries declined (Figure 1), but that what has been spent in recipient countries is increasingly channelled through UK-based organisations, at the expense of those based in recipient countries (Figure 2).
Contract awards disproportionately go to UK companies
Further evidence comes from OECD data on ODA contract awards (a subset of bilateral aid which only includes aid provided by the main development agency, and excludes any officially tied aid or aid not related to procurement, such as budget support and debt relief). This is presented in Figure 3, where the latest data for 2019-20 shows that the UK awarded 85 percent of its ODA contracts to domestic organisations (by value). It has awarded a similarly high share across the last decade, well above the OECD Development Assistance Committee (DAC) average and peer countries like Germany, France and Japan. Though Figure 3 does not show a similar trend to Figure 2, this may be due to the fact that the UK is already running up against the upper limit here. The aforementioned decline in UK provided general budget support would also not show up in this contracts data.
Figure 3: Share of ODA Contract Value Awarded to In-Donor Organisations, 2010-20
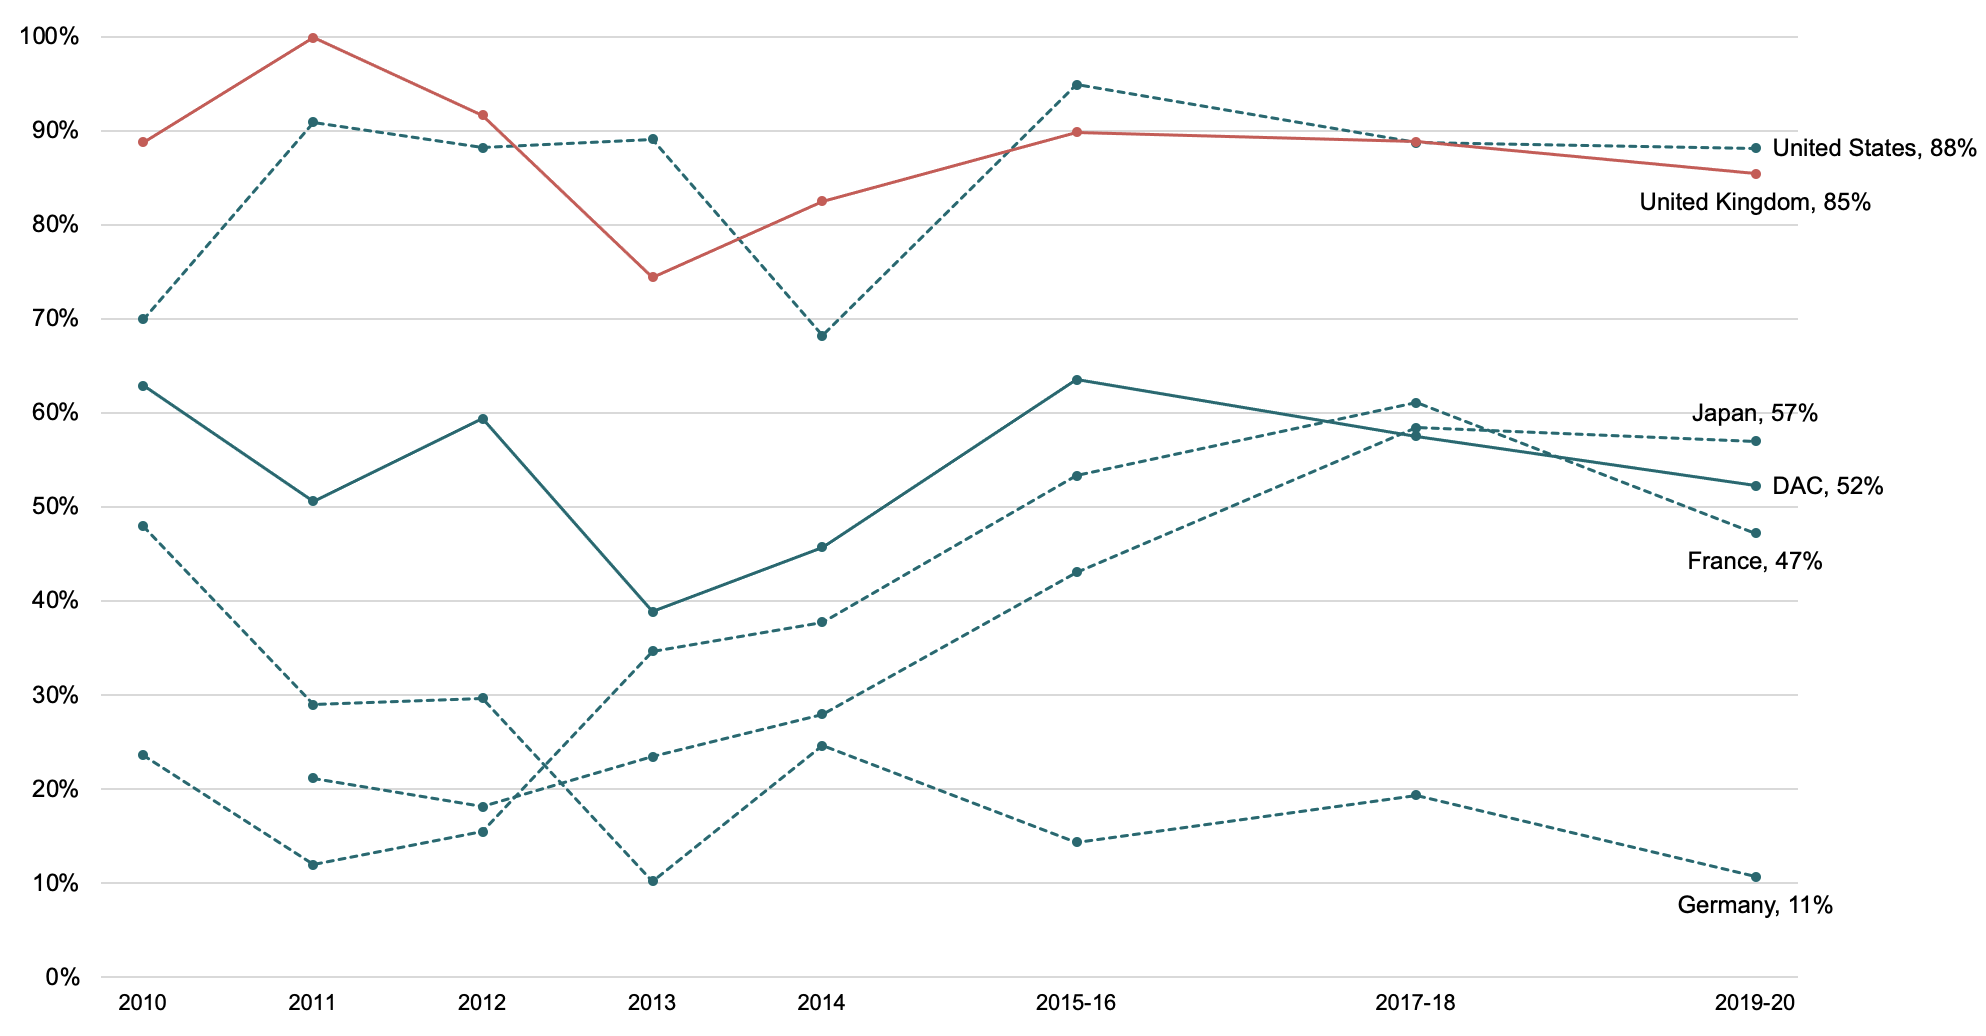
Source: OECD Contract Awards database, via OECD reports on the implementation of the DAC recommendation on untying ODA (see links by data year: 2010,2011, 2012, 2013, 2014, 2015-16, 2017-18, 2019-20).
Note: This ODA contract awards data does not cover all bilateral ODA. For instance, a total contract value of $2.3bn was reported by the UK in 2019-20, which compares to its $25.3bn of bilateral ODA (grant equivalent) disbursed over the same period.
The high share can’t be explained by the size or success of the development sector in the UK. In the latest 2021 edition of our Quality of ODA assessment (QuODA) (for indicator T5), we accessed further contracts data from the OECD which showed that UK organisations had won a total of 7 percent of all the ODA contract value awarded by DAC donors between 2017-18. This overall market share is far from sufficient to explain the 89 percent share of UK ODA contracts won by UK organisations in the same period.
The US story here is also instructive—for almost a decade USAID has sought to improve localisation. While those efforts have new impetus (and the above data only runs to 2020), it’s clear that these efforts had limited effect on this metric.
UK performs below average in working with its recipient partners
Additional evidence on how well the UK works with and through its partner countries to promote local ownership is available from survey data from the Global Partnership for Effective Development Cooperation (GPEDC). The latest full survey is over five years old, but it is the only serious effort to gather recipients’ view and we collate this data in our latest 2021 edition of QuODA.
The UK’s worst performance in QuODA 2021 was on the ownership dimension (where it was ranked 37th out of the 49 donors assessed), which measures how well donors work with and through partner countries to promote domestic ownership and use of national systems. These indicators are measured using 2017 data from the GPEDC’s third monitoring round, which remains the latest available (data from the ongoing fourth monitoring round is now being released on a rolling basis over 2024-26). Table 1 shows UK performance on these Ownership indicators, with all but one below the average of donors assessed by QuODA.
Table 1: UK Performance on Ownership Indicators of QuODA 2021
|
QuODA Ownership Indicator |
GPEDC Indicator |
Short Description |
Description |
United Kingdom (2017) |
QuODA Average |
|---|---|---|---|---|---|
|
O1a |
1a.1 |
Aligning objectives |
Share of development interventions using objectives from partner country owned results frameworks |
69% |
83% |
|
O1b |
1a.4 |
Joint planning of evaluations |
Share of evaluations planned with the involvement of partner country governments |
38% |
56% |
|
O2a |
6.1 |
Use of partner country systems |
Share of ODA reported to partner countries & recorded in their budgets |
40% |
54% |
|
O2b |
9b |
Use of partner country systems |
Share of ODA using partner country's own financial management and procurement systems |
26% |
48% |
|
O3a |
5a.1 |
ODA reliability |
Share of [scheduled] ODA disbursed as scheduled |
97% |
84% |
|
O3b |
5b |
ODA predictability |
Share of ODA covered by forward spending plans |
31% |
54% |
Source: GPEDC monitoring database & QuODA 2021
Note: Not all ODA recipients participate in the GPEDC survey. The O4 indicator of QuODA 2021 captures coverage, and found that the UK received feedback from partner countries covering a greater proportion of its aid than average: 48 percent of the UK’s Country Programmable Aid was allocated to countries that responded to the GPEDC (compared to an average of 43 percent for the donors covered by QuODA).
Whilst the UK performed above average for the reliability of its ODA, it had significant room for improvement on ODA predictability (just 31 percent was covered by forward spending plans), its use of partner country systems (just 26 percent of its ODA used partner countries’ own financial management and procurement systems), and on jointly planning evaluations (just 38 percent of evaluations were planned with the involvement of partner country governments).
The five-year gap between rounds of this survey illustrates the low weight that’s placed on recipients’ views and a push on this agenda would be a valuable component of any new strategy. The UK should take a view on the adequacy and pace of those efforts, and consider options to support a fuller and more frequent effort.
Localisation needs to get beyond rhetoric
The UK meets the DAC objective to de jure untie 100 percent of bilateral aid to the Least Developed Countries (LDCs), Heavily Indebted Poor Countries (HIPCs), Low Income Countries (LICs), and countries eligible for financing from the International Development Association (IDA). Yet its project-level reporting of delivery channels reveals that, de facto, a high and rising share of UK bilateral aid is channelled through UK-based organisations; and data on contract awards, though more limited in coverage, also shows that almost all are won by UK-based organisations.
Survey responses from the UK’s partner countries also show that it mostly performs worse than average when it comes to working with and through partner countries to promote local ownership and use of national systems.
These are some of the important issues we expect the forthcoming UK localisation strategy to consider and address.
Improving localisation can be challenging—our colleagues’ work informed US’s plans, challenges and data on its target to that local organisations should receive 25 percent of eligible funding by 2025. In forthcoming work, Ranil Dissanayake will be exploring further and making practical recommendations for the UK in tackling these issues.
Note: This blog was updated on April 12, 2024 to note that over half of UK bilateral aid was estimated to be spent within the UK in 2023.
Disclaimer
CGD blog posts reflect the views of the authors, drawing on prior research and experience in their areas of expertise. CGD is a nonpartisan, independent organization and does not take institutional positions.
Image credit for social media/web: MOD / DFID