Recommended

An increasing proportion of official development assistance (ODA) is being dedicated to climate, and climate mitigation in particular. Even were that spending highly effective, and despite reaching about $30 billion in 2020, it is not large enough to finance investment that would significantly slow global climate change. But were it effective, 20 years of mitigation finance should have been significant enough to at least bend the curve on emissions in countries receiving large amounts relative to their GNI. Sadly, existing project-level and country-level evidence suggests that, in terms of carbon dioxide abated per dollar of spending, mitigation finance is a considerable distance from being highly effective. That only adds to concerns that the net costs to the world’s poorest countries of diverting development ODA to mitigation may be large. In this note I look at existing evidence and provide additional analysis to suggest past mitigation finance may have had little impact on emissions.
Reporting on mitigation ODA is hazy
What is reported as mitigation finance is somewhat of a mess at both the bilateral and multilateral level (where, for example, 114 different World Bank education projects are tagged with a climate label, including ones that focus on teacher training, education governance, student assessment, education financing, standards, curriculum and textbooks, private sector delivery of education, and access to education—yet their abstracts make no reference to climate change). Climate funds provide little in the way of impact assessments and donors don’t seem to care. Perhaps it should come as no surprise, then, that available evidence on the real-world cost-effectiveness of different emissions mitigation interventions is weak. And estimated costs per ton of carbon abated vary by two orders of magnitude or more in the portfolio of two multilateral climate finance mechanisms –the World Bank Clean Technologies Fund and the Green Climate Fund.
The short-term impact of mitigation ODA looks to be weak
The (sparse) existing literature on mitigation ODA flows and emissions outcomes at the recipient country level does not instill greater confidence. Gavard and Schoch use a lagged approach to look for the association between past climate finance on subsequent emissions and suggest that the relationship is positive over the five years following commitment: one additional billion dollars of mitigation finance per million tons of national emissions is associated with an increase in emissions by a little over 1 percent. They suggest this may be related to construction activities: building low-carbon infrastructure increases emissions hopefully only in the short run. Han and Jun look at climate finance data between 2002 and 2015 and suggest one year lagged mitigation aid is correlated with slightly higher emissions in the subsequent year in low-income countries, slightly lower emissions in lower-middle-income countries and effectively no relationship at all in upper-middle-income economies. Note, this could be for good reasons beyond Gavard and Schoch’s suggestion of construction effects. A positive relationship could appear, for example, if mitigation spending financed an electrified train service currently being powered by electricity generated by coal.
Parsing the long-term relationship between emissions and ODA
To take a different approach to the same mitigation finance data, I try looking for a relationship between aggregate mitigation flows over the longer term and recent CO2 emissions. I look at the relationship between 2020 emissions and cumulative mitigation ODA over 18 years, allowing for the current structure of the economy and the historical emissions intensity of output in the country prior to ODA receipt.
I take recipient-country-level climate mitigation ODA data from the OECD, both the amounts reported as “principally” mitigation and “significantly” mitigation. I divide the annual data by recipient country GNI (constant market 2015 USD) from the World Bank. I sum the finance/GNI values over 2002-2020 (2010-2020 as robustness) to create a cumulative total mitigation ODA as a proportion of GNI. Again, I take kilograms of CO2 emissions per dollar of GDP (in constant 2017 PPP) from 2000 and 2020 (2010 and 2020 for a robustness exercise) from the World Bank. I use 2020 emissions as my dependent variable and 2000 emissions (or 2010 in the robustness exercise) as a control. Following the existing literature, I add controls—the log of GNI per capita ($PPP 2017) and Log GNI per capita squared, industry as a percent of GDP, exports as a percent of GDP and urbanization, all in 2020, also from the World Bank.
The basic regression is:
2020 CO2/GDP = α*(2000-19 cumulative mitigation ODA/GNI 2000-19) + β*(2000 CO2/GDP) + C
The first five regressions use cumulative principal and significant mitigation ODA, the last limits to principal ODA. The second and subsequent regressions add control variables. The fourth regression uses a 2010 starting point rather than 2000. The fifth regression excludes the sample that received mitigation ODA.
The mitigation ODA analyzed totals $185 billion. To put that number in perspective, 10-year cumulative spending under the US landmark climate bill, the US Inflation Reduction Act, will be $400 billion. For 10 countries, mostly small island states, the cumulative total of mitigation ODA as a percentage of GNI over 20 years is more than 10 percent. These countries are Rwanda, Mozambique, Bhutan, Solomon Islands, Vanuatu, Burundi, Cabo Verde, Marshall Islands, Tonga and (at a cumulative total of 28 percent of GNI) Kiribati. For another 25 countries it is above 5 percent and for a total of 81 countries it is above 1 percent. Ten-year cumulative spending under the US Inflation Reduction Act adds up to about 1.6 percent of US GDP. If we expect the Inflation Reduction Act to significantly bend the curve on emissions in the US, it is perhaps not too much to hope that similar relative expenditure might have some impact in recipients of mitigation ODA.
|
P&S |
P&S |
P&S |
2010 P&S |
Nonzero P&S |
P |
||
|---|---|---|---|---|---|---|---|
|
Intercept |
0.0560 |
-0.6091 |
-0.6213 |
-0.4894 |
-0.0204 |
-0.4937 |
|
|
Mitigation ODA |
0.2242 |
0.2609 |
0.2723 |
0.0450 |
0.1573 |
0.7098 |
|
|
Initial CO2 |
0.5063 |
0.4797 |
0.4761 |
0.6682 |
0.5123 |
0.4786 |
|
|
LNGNIPC20 |
0.1416 |
0.1447 |
0.1186 |
0.0059 |
0.1176 |
||
|
LNGNIPCSQ20 |
-0.0080 |
-0.0085 |
-0.0070 |
0.0002 |
-0.0068 |
||
|
IND20 |
0.0023 |
0.0023 |
0.0017 |
0.0008 |
0.0022 |
||
|
EXP20 |
0.0000 |
||||||
|
URB20 |
0.0004 |
||||||
|
Adjusted R Square |
0.6011 |
0.6387 |
0.6363 |
0.7860 |
0.6788 |
0.6410 |
|
|
N |
140 |
140 |
140 |
140 |
101 |
140 |
Notes: Dependent variable is 2019 kg of CO2 emissions per 2017 PPP $ of GDP. Initial CO2 is emissions per 2017 PPP$ of GDP in 2000 (columns 1-4, 6&7) or 2010 (column 5). There is a positive but insignificant correlation between mitigation and ODA absent any other controls.
Mitigation ODA isn't associated with lower emissions
The short answer from the analysis is that there is no obvious association between mitigation spending and lower emissions. Indeed, the sign of the coefficient on mitigation ODA is positive: in two economies with similar incomes, levels of industrialization and historical emissions levels, the economy which has received more mitigation ODA between 2002-20 is likely to see slightly higher emissions in 2020 than the country that received less mitigation ODA.
Mitigation aid could have a big, negative, causal impact on emissions despite there being a positive correlation in observational data. And even leaving aside the lack of any identification strategy that allows for convincing talk of causation, that positive association between mitigation finance and emissions should not be overplayed. While the significance of the result is robust to focusing solely on ODA principally designed to mitigate (excluding ODA “significantly” designed to mitigate), the positive relationship of mitigation ODA loses statistical significance if: you look at the bivariate relationship of emissions against cumulative ODA; you take out countries that received cumulative 10 percent of GNI or more in mitigation spending; you focus only on mitigation ODA since 2010 (and initial CO2 emissions from that year); or you restrict the sample to countries that received nonzero quantities of mitigation ODA. Estimates by my colleague Zack Gehan also suggest a lack of significance using (pre-pandemic) 2019 emissions and GNI as the endpoint of analysis. Even where significant, the coefficients suggest that cumulative mitigation aid worth 1 percent of GDP between 2000 and 2019 would be associated with CO2 emissions per 2017 PPP $ of GDP that were higher by about 2.6 grams, or only 3 percent of a standard deviation of emissions per kilogram.
That said, under all of these exercises, mitigation ODA still carries a positive coefficient, where we would like to see a negative (and preferably large and significant) sign. Evidence is lacking that mitigation ODA is associated with lower emissions in the long term. Hopefully climate finance is encouraging countries to make commitments to ramp down emissions faster than they would otherwise and, in the long term, if they deliver, that will create a dramatic return. But the first 20 years of financing don’t provide any straightforward evidence of the multiplier as of yet.
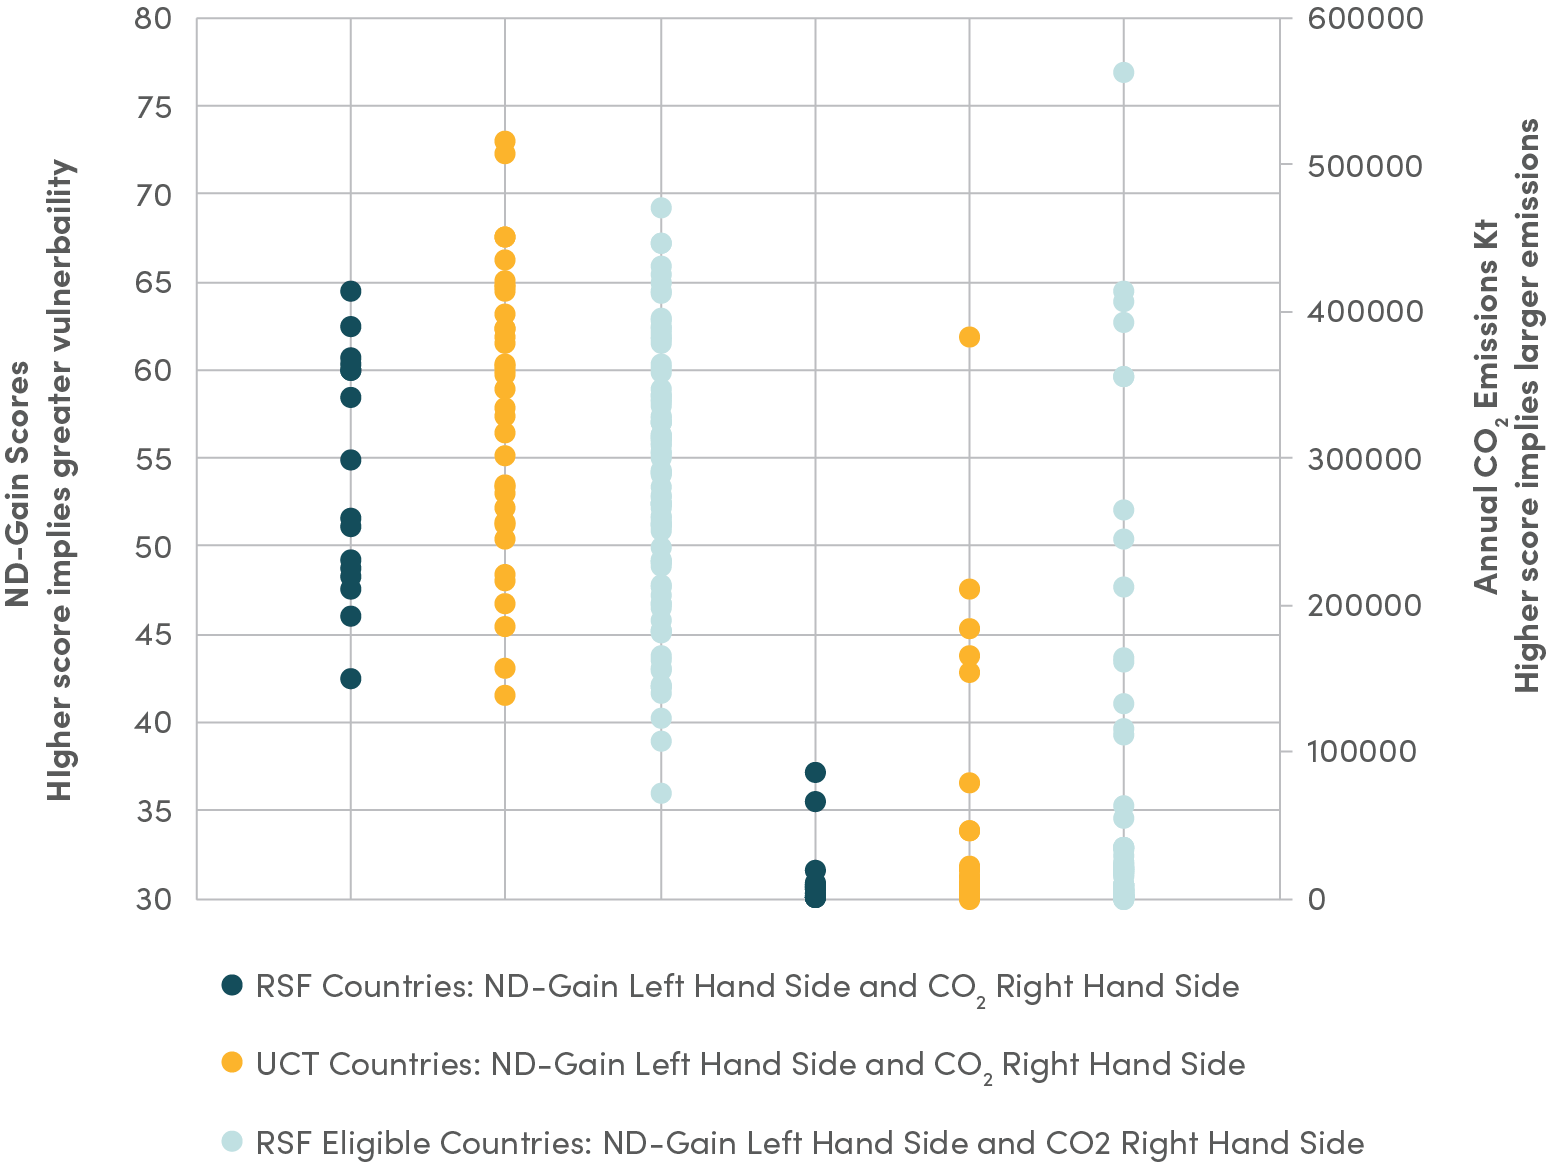
The extreme case of Kiribati
This can be further illustrated by looking at the country that has received the most mitigation finance compared to the size of its economy. Between 2000 and 2019 over which time Kiribati has received $68 million in mitigation finance worth a cumulative 28 percent of GNI, it has emitted 1.2 million tons of carbon dioxide, with annual emissions rising from 36,000 to 57,000 tons. At a price of $90/ton, around the current (high) level in the EU emissions trading regime, $68 million in mitigation spending might be expected to reduce emissions by 0.76 million tons, or a little less than two thirds of Kiribati’s total emissions. Kiribati deserves considerable adaptation finance given that many of its islands may become uninhabitable as a result of climate change and sea-level rise over the course of the century. But its vulnerability also means it will disproportionately benefit from effective mitigation finance. And it doesn’t appear that ODA is being used to deliver efficient mitigation results, including in Kiribati itself.
Rethinking mitigation ODA
One explanation for little obvious evidence of impact is that a lot of mitigation finance appears to be mitigation in name only. It is possible that the underlying projects may still be very good in terms of delivering broader development even if they may fail at efficiently reducing emissions. Until such time as the costs of zero carbon technologies decline, the available global financing for climate increases dramatically, and methods to spend it well are designed and rolled out, I am broadly in favor of (actually spent) development-focused ‘mitigation’ finance, because, even well spent, it will have a marginal impact on overall climate trends while it can have a larger impact on development trends in the poorest countries.
On the other hand, mitigation finance disburses more slowly than traditional ODA, is increasingly being used to finance activities outside recipient countries, and it is increasingly targeted at middle income countries, not the poorest. While the largest recipients of mitigation ODA as a percentage of their GDP are mostly small island states, the top ten recipients of mitigation aid in this data in terms of absolute volume, accounting for more than half of the total, are Egypt, Türkiye, Brazil, Morocco, Philippines, Vietnam, China, Bangladesh, Indonesia and India. None are low-income economies, and upper middle income countries predominate. Even if the projects supported deliver development (and that is no certainty), the financing is not spent where it can have the greatest impact on development outcomes.
Carbon finance is what we got when we couldn’t agree a global carbon market. So far, it is yet to be demonstrated that it is a good substitute. Especially if the financing comes at the cost of development ODA to lower-income countries (and especially quality ODA of the type delivered through the World Bank’s International Development Association), that’s a real loss to the poorest countries that are least responsible for, but will suffer the most from, climate change. It is possible to imagine low transactions-cost, results-based approaches to reduce emissions: perhaps a fund for emission reduction payments which pays out to low-emitting countries on the basis that they are following an emissions trajectory that is lower than would be expected under business as usual. But at least until such time as it is reasonable to believe mitigation finance is sufficient, targeted and efficient enough to make a significant impact on global emissions, grant resources including ODA should be reserved for adaptation and development projects in the world’s poorest countries.
Rights & Permissions
You may use and disseminate CGD’s publications under these conditions.
Image credit for social media/web: martin33 / Adobe Stock