Recommended

Blog Post
This year, the International Development Association (IDA)—the World Bank’s concessional lending arm for the world’s poorest countries—is seeking fresh funding from its donors to finance its next three-year cycle (“IDA21”). IDA is the single largest source of grants and concessional finance for the world’s poorest countries. It has been a lifeline for low-income countries that have been battered by a series of external shocks since the COVID-19 pandemic. And in a world where external financing is retreating from frontier economies, IDA is now the largest source of positive net funding for many low-income countries.[1],[2]
Against this backdrop, World Bank President Ajay Banga has challenged donors to make IDA21 a record $100-billion replenishment.[3] Given IDA’s ability to leverage its funds, achieving this headline figure will require $28–$30 billion in donor contributions, or a 20–30 percent increase over the IDA20 cycle in nominal dollar terms (a flat-to-10-percent increase in real terms).
A $100-billion target sets the right scope of ambition. It would allow IDA to sustain around $33 billion in commitments a year over the IDA21 cycle (2025-2027). An even more ambitious yardstick would be $36 billion a year in commitments: the average level that IDA achieved over the past three years (i.e., over the two years of IDA19 and the first year of IDA20). That would mean a replenishment closer to $110 billion. African leaders recently raised the stakes further calling for a $120 billion replenishment at the African Heads of State Summit in Nairobi in April 2024.[4]
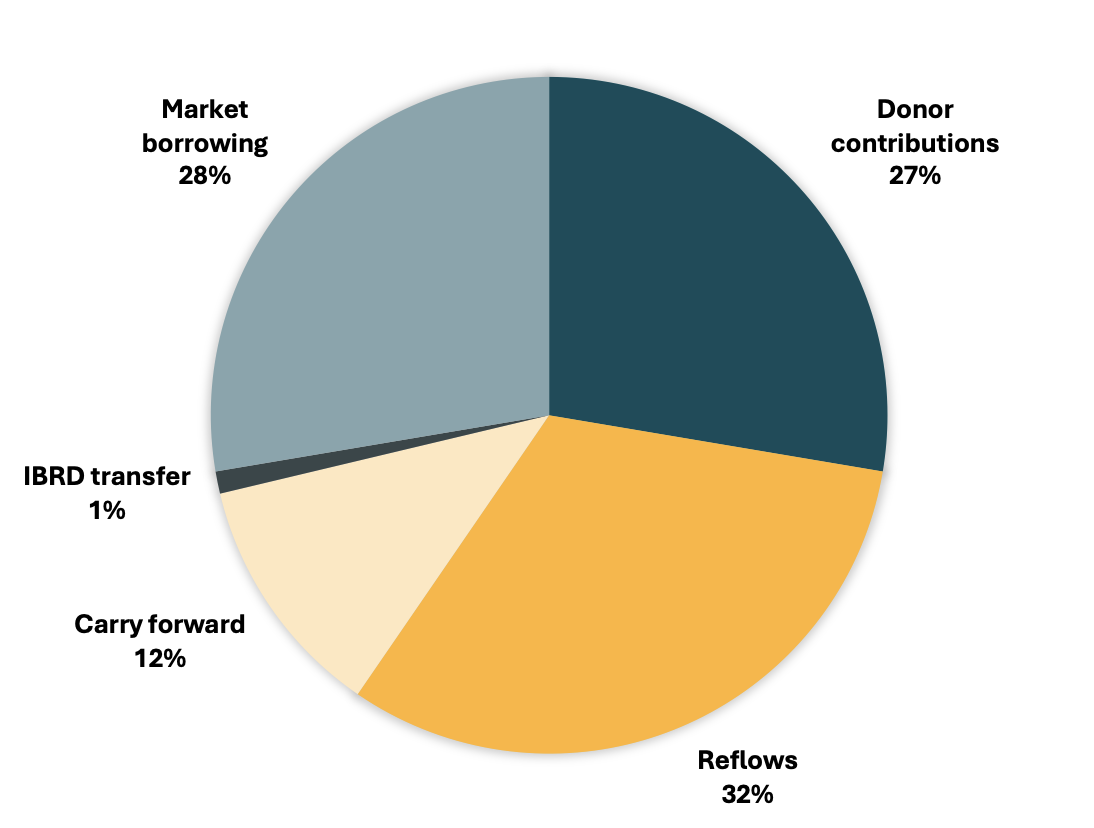
Figure 1. Estimated sources of IDA 20 funding
Source: CGD staff calculations
The arithmetic for getting to a replenishment in the $100–$120 billion range is difficult. There is no path to a bigger IDA without an increase in donor contributions. And while donors are no longer IDA’s dominant funding source, they affect other components of IDA’s financing model, especially market borrowing, which is backed by IDA equity and only accessible to IDA clients if merged with donor grants to generate highly concessional loans.
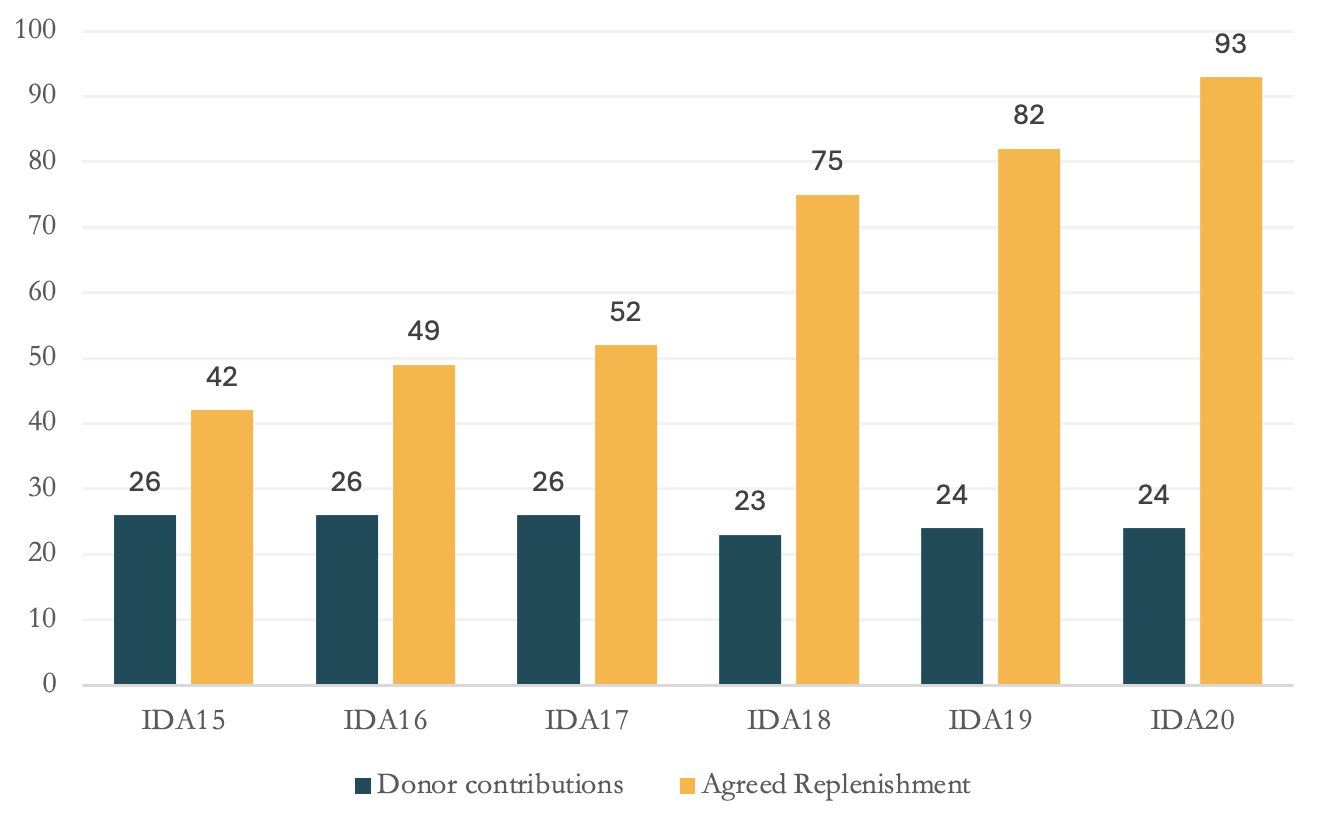
But donor contributions have been flat to IDA for almost a decade in nominal terms. (In real terms, contributions have declined by roughly 20 percent over the past decade.) Already, many large IDA donors have privately signaled that even staying flat this year will be an arduous political lift.
To succeed in this environment, IDA will need to rally a coalition of donors to come in with big pledges, continue to sustain its market borrowing program, and secure an increase in net income transfers from other parts of the institution.
Table 1. IDA 101: How IDA’s hybrid financial model works
Simplified IDA versus IBRD Balance Sheet (in billions of $)
| IDA | IBRD | ||||||
|---|---|---|---|---|---|---|---|
|
Total Assets |
235 |
Liabilities |
48 |
Total Assets |
342 |
Liabilities |
280 |
|
Net Investment Portfolio |
33 |
Borrowing |
41 |
Net Investment Portfolio |
76 |
Borrowing |
251 |
|
Net loans outstanding |
194 |
Other liabilities |
7 |
Net loans outstanding |
253 |
Other liabilities |
29 |
|
Other Assets |
8 |
Equity |
187 |
Other Assets |
13 |
Equity |
62 |
Source: IDA and IBRD Financial Statements
Historically, IDA’s main funding sources have been donor contributions and reflows from loans. Starting in the IDA18 cycle (2017-2019) IDA began to issue market debt against its equity base (largely comprised of net loans outstanding). This allowed IDA to grow its replenishment size even as donor contributions went down. IDA’s hybrid financing model combines characteristics of a cash-in cash-out window that needs to be regularly replenished by donors, and a bank that issues debt in the market against its equity to finance its lending. IDA remains significantly less leveraged than the IBRD (the International Bank for Reconstruction and Development, the World Bank’s hard loan lending instrument) because of the riskier credit quality of its portfolio. (See above table.)
Figure 2. Composition of past IDA replenishments ($ billions)
In addition, IDA passes on the bulk of proceeds from its market borrowing to clients on concessional terms (i.e., by blending market loans with grants or reflows to achieve more generous terms), with a small amount going out on non-concessional terms to more creditworthy lower-middle-income countries (i.e., countries in the “blend” category or IDA-eligible countries that are at low risk of debt distress).
Because concessional terms are exceptionally generous (e.g., 30–50 years credits with a 0–2 percent annual service charge), high levels of donor grants are needed to blend with market borrowing. In addition, 38 IDA countries are only eligible for grants due to their high risk of debt distress.[5] Therefore, the worse the debt profiles of IDA countries, the more donor funding is needed.
Table 2. Getting to $100 billion: The math of a record replenishment
|
Stylized IDA21 Scenarios ($ billions) |
IDA 20 |
|||
|---|---|---|---|---|
|
Total |
$100 billion goal |
$110 billion goal |
$120 billion goal |
$93 billion |
|
Donors |
28 |
33 |
38 |
24 |
|
Multilateral Debt Relief Initiative (MDRI) compensation |
2 |
2 |
2 |
2 |
|
Transfers |
4 |
4 |
4 |
1 |
|
Reflows (and other income) |
38 |
38 |
38 |
41 |
|
of which carryforward |
tbd |
tbd |
tbd |
11 |
|
Borrowing |
28 |
33 |
38 |
25 |
|
Donor/replenishment size ratio |
3.6 |
3.3 |
3 |
3.8 |
Source: CGD staff calculations
A simple way of thinking about IDA financing is through a cash flow model where IDA’s funding sources add up to the total replenishment volume. This is the framework IDA used prior to introducing the hybrid model. IDA now employs a more sophisticated capital adequacy model to determine how much it can borrow over several replenishment cycles.[6]Still, for understanding the financing dynamics of a single replenishment, it is useful to look at the different inputs of the IDA model to see how the numbers add up. For IDA20, reflows were the largest funding source (around $30 billion, plus $11 billion in unspent funding from IDA19 which was only for two years), followed by market borrowing, donor contributions, and transfers from IBRD to IDA. In this case, donor contributions were leveraged nearly four times. For IDA21, donors will need to provide a higher proportion of the final amount because there will not be as large of a carryforward as there was for IDA 20. This means the leverage ratio will fall to 3.6x or below.
Donors
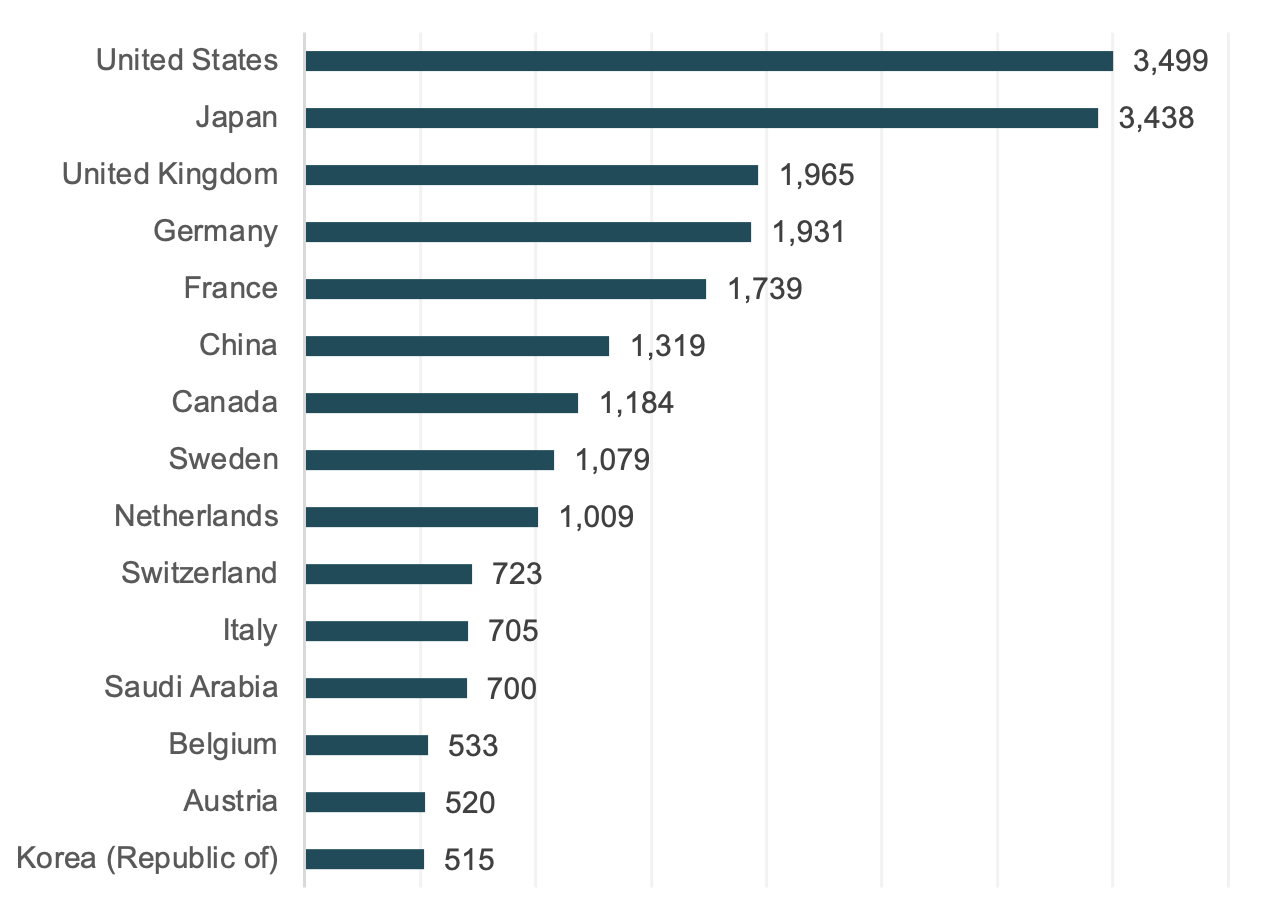
Last cycle, donors pledged $23.5 billion to IDA20, which had a total replenishment size of $93 billion. To get to a $100-billion-plus replenishment for IDA 21, donors will need to get to at least $28–$30 billion in total contributions. This would represent a 20–30 percent overall increase in nominal terms.
IDA20 had 52 donors, but over 90 percent of its contributions come from its 15 largest donors. IDA20’s top five donors (all G7 countries) make up more than half of total donor contributions.
Figure 3. IDA20 Top 15 donors (millions of USD)
Source: IDA 20 Deputies Report, https://documents.worldbank.org/en/publication/documents-reports/documentdetail/163861645554924417/ida20-building-back-better-from-the-crisis-toward-a-green-resilient-and-inclusive-future
Significantly expanding donor contributions is challenging for two reasons. First, many of IDA’s largest donors have reduced aid to low-income countries, instead increasing support to Ukraine and for climate mitigation financing.[7]
Second, the strong dollar means staying flat in dollars will require an increase in domestic currency for many donors. This is because donors generally make pledges and payments in their own currencies, but IDA headlines are in dollars and special drawing rights. Since the IDA20 pledging session in December 2021, several major currencies have significantly depreciated against the dollar. As an example, in Japan—IDA 20’s second largest contributor—the yen has depreciated nearly 25 percent against the dollar. Less dramatic, but still noteworthy, the British pound sterling depreciated 7 percent against the dollar over the same period, and the Euro depreciated by 5 percent. This means that if the IDA21 pledging session were held today, Japan would need to increase its contributions by 25 percent, the UK by 7 percent, and Europeans by 5 percent just to stay flat with the previous cycle in dollar terms.
Because a few donors dominate IDA, the ideal path to a record replenishment is for its top donors to drive the growth. For instance, if the top 15 donors increased an average of 20 percent in dollars, and the rest grew 5 percent, IDA could reach nearly $28 billion in donor contributions. For many top donors, IDA’s share of their total official development assistance, or ODA—including the United States, Germany, and France—is less than 5 percent, so an increase to IDA could be accomplished even if their overall aid budget remains flat, by re-allocating from other parts of their aid budgets.
A reallocation towards IDA makes good policy sense since IDA has a multiplier effect on contributions. For example, the US gives IDA around $1.2 billion a year, but IDA provides over $30 billion a year in loans and grants to its client countries using that contribution. By virtue of its multilateral model and financial leveraging effects, IDA provides a uniquely strong benefit to donors relative to bilateral assistance where “one dollar in” tends to translate to “one dollar out.”
IDA21 also presents an interesting opportunity for some countries to significantly increase their positions within IDA. If China pledged twice as much this cycle as it did for IDA20, it could overtake France, Germany and even the United Kingdom, to become the third-largest IDA contributor. If South Korea were to double its IDA20 pledge this cycle, it could become a top-10 IDA donor. If Saudi Arabia were to double its IDA pledge, it could surpass many key Nordic donors as well as Canada.
A doubling of funding from China, South Korea, and Saudi Arabia, alongside 25–30 percent increases from a handful of large G7 donors—say the United States, France, and United Kingdom—could get IDA into the $28 billion range, provided other donors maintain overall flat dollar contributions.
Finally, IDA’s financing framework also includes Multilateral Debt Relief Initiative (MDRI) compensation from donors, which is fixed at $2 billion for IDA 21.[8] As part of the global debt relief initiative known as “HIPC,” donors agreed in 2006 to compensate IDA at each replenishment for the foregone reflows associated with debt relief. The MDRI contributions are not counted towards donor contributions for IDA21 in this note.
Transfers
Two of the other parts of the World Bank Group, IBRD (the International Bank for Reconstruction and Development, the arm of the World Bank that lends to middle-income countries) and IFC (the International Finance Corporation, the private-sector lending arm) regularly turn a profit with their lending, a portion of which has been used to support IDA lending. Net income transfers from IBRD and IFC to IDA have been a dwindling component of the overall package, currently around 1 percent of total IDA20 funding (i.e., under $1 billion). But this has not always been the case. Prior to 2017, most of IBRD’s allocable income was going to IDA. At its zenith in IDA16, IBRD’s transfers to IDA amounted to $1.9 billion a cycle.
In 2017, the IBRD board adopted a formula-based approach to determine the annual IDA transfer level which significantly reduced the amounts (see table). The IBRD transfer will be around $800 million in IDA20.
Figure 4. IBRD annual income allocation (in $ million)
Source: IBRD Financial Statements, https://financesapp.worldbank.org/summaryinfo/ibrd/
The good news is that IBRD’s profits are at record highs—buttressed by a bigger loan book and higher interest rates—and will likely continue to grow over the medium term. Last fiscal year, IBRD allocable income was $1.3 billion. As a result of this growth, the IBRD transfer formula could yield a total resource transfer to IDA as high as $2.5 billion over the three-year IDA21 period. Another option would be to negotiate an exceptional top-up to IDA above and beyond the formula amount, as I propose in table 2, which has $4 billion (potentially including the IFC, as discussed below).
The key issue here will be around reconciling a bigger IDA transfer with claims on net income from the World Bank’s new Livable Planet Fund, which will likely also be capitalized through IBRD profits.
IFC for its part discontinued transfers to IDA following an agreement made in 2018 to support IFC’s expansion of activities in IDA countries.[9] Stakeholders could consider a review of this arrangement, especially since a recent Independent Evaluation Report determined that IFC has limited success in expanding its activities in IDA countries.[10]One option is to tie the renewal of the Private Sector Window (PSW) to restoring IFC’s transfer to IDA of around $1 billion per cycle.
Reflows and other internal resources
A potential bright spot for IDA21 is on the reflow side. According to the World Bank’s International Debt Statistics (IDS) database, repayments could be around $36 billion in IDA21 (up from an estimated $30 billion in IDA20). This would help offset the absence of the $11 billion carryforward of resources linked to the shortened IDA19 funding cycle that helped buttress IDA20 financing. Adding reflows with other sources of internal resources including investment income and allowing for a small carryforward, total internal resources could be in the $38 billion range.
Market borrowing
For IDA21 to break $100 billion, market borrowing will need to remain an important part of the mix. But there are tradeoffs associated with the program that stakeholders need to consider. While borrowing helps IDA attain higher headline volumes, it does not provide concessionality. A recent study conducted by Risk Control concluded that IDA’s ability to borrow is significantly higher than its current capital model allows but it is limited by the need to on-lend on highly concessional terms.[11]
This limit is particularly acute in a high interest rate environment. This is because IDA’s funding costs have increased, which makes it more expensive to on-lend its market borrowing on concessional terms (which have remained fixed). When the interest rate environment was benign, IDA was paying on average 0.6 percent coupon on its issuances. But since the Fed rate hikes, IDA is now paying an average 4 percent coupon to borrow, albeit at longer maturity. This means the cost of buying down $1 dollar in market borrowing has increased from around 10-20 cents to closer to 30-40 cents.
Another option under discussion is to pass along more of the costs to IDA countries in the form of less concessional loans or by substituting grants with concessional loans (e.g., with a 70-year repayment period). The idea is that more non-concessional loans and fewer grants would allow IDA to build more equity and borrow more.
When weighing these tradeoffs, the imperative of preserving IDA as a model responsible lender should be the overriding objective.[12]This is especially true for the 38 IDA countries that are now at high risk of debt distress. On the other hand, countries that are at low risk of debt distress or countries in the blend/gap categories may be eager to take on bigger volumes from IDA at less concessional rates. From a debt sustainability perspective, this could make sense since a non-concessional IDA loan is still significantly cheaper than the prices many frontier economies are paying to borrow from capital markets today.[13] Currently, only around 6 percent ($11 billion) of IDA’s outstanding loan portfolio is on non-concessional terms, so there is clearly room to expand the program.
Finally, many IDA stakeholders also point to the constraints imposed by its capital adequacy model, which limits the amount of borrowing that it can engage in and which requires IDA to hold significant resources on hand to cover potential losses. According to its capital adequacy framework, IDA only has $40 billion in deployable strategic capital available. One way to expand this headroom is to launch a shareholder portfolio guarantees program similar to IBRD’s, where donor would backstop a portion of IDA’s portfolio.[14] This could be a low-cost mechanism for growing IDA’s program.
Conclusion
What size to make this IDA replenishment is one of the most consequential decisions international economic policymakers will face this year. IDA faces many headwinds—difficult aid politics in key donor countries; a high-interest rate environment that renders its financial model less efficient; and deteriorating credit quality in many of its client countries that makes risk taking less appealing. Breaking the $100 billion mark is not a politically expedient proposition. But it is necessary if global poverty reduction is to remain within reach.
References
Aboneaaj, Rakan, and Clemence Landers, July 2023, Three Questions About the World Bank’s New Portfolio Guarantee Program, Center for Global Development, https://www.cgdev.org/blog/three-questions-about-world-banks-new-portfolio-guarantee-program
IDA, June 2023 Financial Statements https://thedocs.worldbank.org/en/doc/b38629a142167d3f5b6dcf39646379c5-0040012023/original/IDA-Financial-Statements-June-2023.pdf
Kenny, Charles, February 2024, Has the IDA PSW Increased IFC Investments in IDA Countries?, Center for Global Development, https://www.cgdev.org/blog/has-ida-psw-increased-ifc-investments-ida-countries
Landers, Clemence, and Nico Martinez, March 2024, Is Sub-Saharan Africa’s Credit Crunch Really Over?, Center for Global Development, https://www.cgdev.org/blog/sub-saharan-africas-credit-crunch-really-over
Landers, Clemence, and Hannah Brown, November 2023, Is IDA Equipped for Another Debt Shock?, Center for Global Development, https://www.cgdev.org/blog/ida-equipped-another-debt-shock
Lawder, David, December 2023, World Bank's Banga calls for record replenishment of fund for poorest countries, Reuters, https://www.reuters.com/world/africa/world-banks-banga-calls-record-replenishment-fund-poorest-countries-2023-12-06/
OECD, April 2024, International aid rises in 2023 with increased support to Ukraine and humanitarian needs, https://www.oecd.org/newsroom/international-aid-rises-in-2023-with-increased-support-to-ukraine-and-humanitarian-needs.htm
Risk Control, September 2023, Ratings and Capital Constraints on IBRD and IDA, https://www.riskcontrollimited.com/wp-content/uploads/2023/10/Ratings-and-Capital-Constraints-on-IBRD-and-IDA-23-57a-1-9-23-v70.pdf
Saigal, Kanika, April 2024, African leaders want World Bank’s IDA fund increased to $120bn, The Africa Report, https://www.theafricareport.com/346248/african-leaders-want-world-banks-ida-fund-increased-to-120bn/
Summers, Lawrence, and N.K Singh, April 2024, The World Is Still on Fire, Project Syndicate, https://www.project-syndicate.org/commentary/imf-world-bank-spring-meetings-need-to-get-four-things-right-by-lawrence-h-summers-and-n-k-singh-2024-04
U.S Government Accountability Office, June 2022, Report to Congressional Requesters on the International Development Association, https://www.gao.gov/assets/d22104657.pdf
World Bank, March 2006, Multilateral Debt Relief Initiative (MDRI) approved, https://timeline.worldbank.org/en/timeline/eventdetail/3251
World Bank, April 2024, An Introduction to Capital Adequacy in IDA’s Hybrid Financial Model, https://thedocs.worldbank.org/en/doc/d4447da2f89d0e75a7a4688179200bd1-0410012024/original/An-Introduction-to-Capital-Adequacy-4-9-2024.pdf
Footnotes
[1] https://www.project-syndicate.org/commentary/imf-world-bank-spring-meetings-need-to-get-four-things-right-by-lawrence-h-summers-and-n-k-singh-2024-04
[2] https://www.cgdev.org/blog/sub-saharan-africas-credit-crunch-really-over
[3] https://www.reuters.com/world/africa/world-banks-banga-calls-record-replenishment-fund-poorest-countries-2023-12-06/
[4] https://www.theafricareport.com/346248/african-leaders-want-world-banks-ida-fund-increased-to-120bn/
[5] https://www.cgdev.org/blog/ida-equipped-another-debt-shock
[6] https://thedocs.worldbank.org/en/doc/d4447da2f89d0e75a7a4688179200bd1-0410012024/original/An-Introduction-to-Capital-Adequacy-4-9-2024.pdf
[7] https://www.oecd.org/newsroom/international-aid-rises-in-2023-with-increased-support-to-ukraine-and-humanitarian-needs.htm
[8] https://timeline.worldbank.org/en/timeline/eventdetail/3251
[9] https://www.gao.gov/products/gao-22-104657
[10] https://www.cgdev.org/blog/has-ida-psw-increased-ifc-investments-ida-countries
[11] https://www.riskcontrollimited.com/wp-content/uploads/2023/10/Ratings-and-Capital-Constraints-on-IBRD-and-IDA-23-57a-1-9-23-v70.pdf
[12] https://www.cgdev.org/blog/ida-equipped-another-debt-shock
[13] https://www.cgdev.org/blog/sub-saharan-africas-credit-crunch-really-over#:~:text=After%20an%20almost%20two%2Dyear,the%20first%20quarter%20of%202024.
[14] https://www.cgdev.org/blog/three-questions-about-world-banks-new-portfolio-guarantee-program
Rights & Permissions
You may use and disseminate CGD’s publications under these conditions.


