As many developing countries approach universal enrollment in primary school, the World Bank has emerged as one of the most prominent advocates for a pivot “from schooling access to learning outcomes” in recent decades. The most recent education strategy of the Bank, adopted in 2011, emphasizes the need to shift focus from schooling to learning. This represented a marked departure from the previous sector strategy, adopted in 2005, which retained the central focus on equitable access to primary education. Particularly since the publication of the 2018 World Development Report, the Bank has played a key role in placing the “learning crisis” at the center of the global education narrative. With over $4 billion in new education lending each year, the Bank has the means to put its money where its mouth is. But, does it?
In a new working paper, we analyzed the evolution of World Bank financing for education over the past two and a half decades against the backdrop of the shift in narrative. We draw on a novel dataset that we have constructed by coding the Project Development Objectives (PDOs) of 815 education projects implemented between 1998 and 2022.
Looking at actual lending data, there is no obvious shift from “schooling” to “learning” since the adoption of the “Learning for All” strategy in 2011
Over the past two decades there has been a steady increase in World Bank financing of education projects in absolute terms. Although primary education continues to absorb the largest share of Bank financing, that proportion has declined from almost half in 1998 to just under a third in 2022. The share spent on secondary education peaked in the early 2000s, falling back down to about a fifth. The one area that has witnessed a relatively consistent and disproportionately large increase in the share of World Bank financing since the early 2000s is preschool or early childhood education (ECE), as shown in Figure 1.
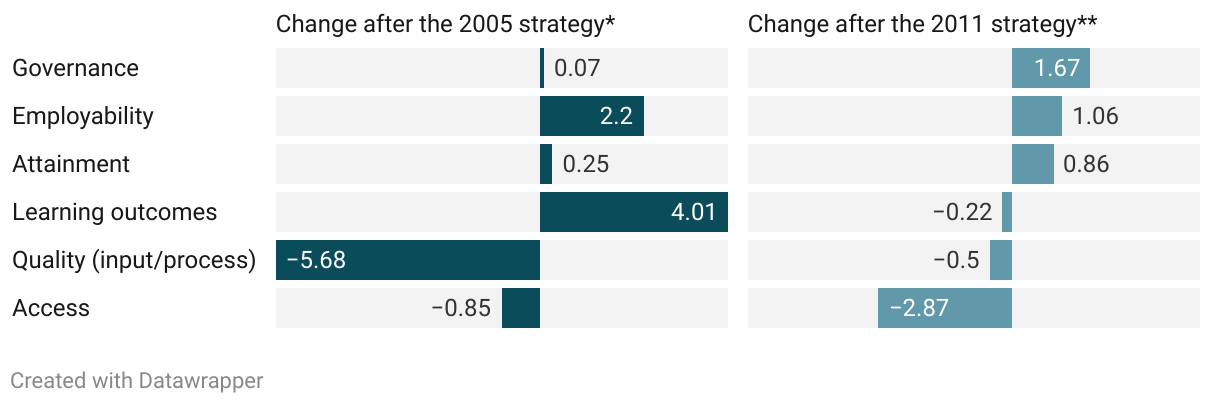
Figure 1: The share of financing for primary education has declined while the share of early childhood education has increased relatively consistently.
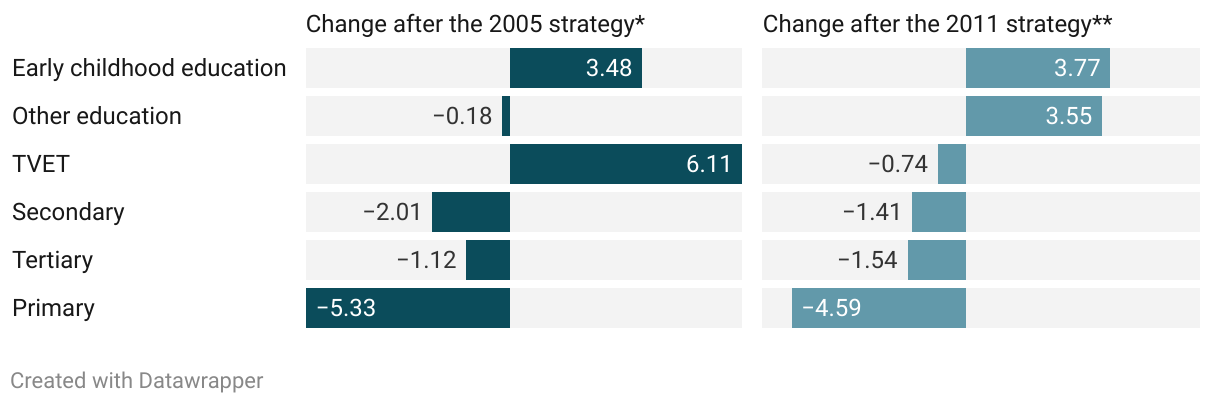
Notes: “Change after the 2005 strategy” represents percentage point change in the share of projects in each subsector, comparing 1998-2005 to 2006-2011. Similarly, “Change after the 2011 strategy” stands for the change between 2006-2011 and 2012-2022. Subsector designations are not mutually exclusive as projects often cover multiple education subsectors. Therefore, this graph is based on both the primary and secondary subsectors of a project. This means a project that focuses on multiple subsectors, for instance primary education and ECE, is represented under all relevant categories. The percentage share of each subsector for a given year is weighted by the total value of World Bank commitment for projects associated with that subsector in that particular year.
When it comes to thematic focus, projects aiming to expand access to education have taken the largest share of financing over the past quarter century. Despite a relative decline in recent periods (shown in Figure 2), access remains the dominant objective, with a quarter of World Bank education financing since the 2011 strategy focused on this. The Bank’s effort to improve education quality normally takes the form of projects that simply aim to improve the quality of inputs or projects which go further to explicitly target specific outcomes. Our coding of PDOs distinguishes between the two types of projects because this distinction is a key part of the narrative that gave impetus to the emergence of “learning” as the central de jure focus area of the Bank since the adoption of the 2011 “Learning for All” strategy.
Figure 2: The average share of projects targeting “learning outcomes” has declined after the “Learning for All” strategy was adopted in 2011.
Notes: “Change after the 2005 strategy” represents percentage point change in the share of projects targeting each objective, comparing 1998-2005 to 2006-2011. Similarly, “Change after the 2011 strategy” stands for the change between 2006-2011 and 2012-2022. Most projects are designed to address multiple objectives. Therefore, a single project could be counted as many times as it has distinct objectives. The percentage share of each objective for a given year is weighted by the total value of World Bank commitment for projects associated with that objective in that particular year.
If there was any pivot from schooling to learning, it came before the 2011 strategy update, not after it
Between 2005 and 2011 the share of World Bank education projects targeting input quality dropped by almost 6 percentage points and the share explicitly focused on learning outcomes grew by 4 percentage points (Figure 2). This was likely driven by the emphasis placed on a results-oriented approach in the 2005 strategy update. However, following the 2011 strategy which was supposed to usher in a pivot to learning, the average share of projects targeting either input quality or learning outcomes has declined. To be sure, there have been notable spikes in lending for projects focusing on learning outcomes immediately after the 2011 strategy was adopted and more recently as part of the COVID recovery efforts. But these were mostly followed by equally sharp falls in lending for such projects.
On the demand side, as countries approach universal primary enrollment, they are more likely to borrow for early childhood education
The prevailing concern about a “learning crisis” emanates from the increasing number of children that are going through primary school without meeting appropriate learning milestones. As such, the implied solution is to continue to invest in primary education, but to shift the focus from access to learning outcomes. However, the above analysis shows that, as far as the World Bank is concerned, lending seems to be moving away from primary education altogether, while access continues to dominate the list of objectives. So, what is driving this?
One explanation is that once countries reach universal primary enrollment, they move on to borrowing for something else. The data supports this theory, in that an increase in primary enrollment is associated with a decrease in the likelihood of borrowing for primary education (Figure 3). At the same time, the probability of borrowing for secondary education or early childhood education increases as the primary enrollment rate rises.
A similar pattern is visible over time, as well as across countries. When we look longitudinally at project cycles within countries, we find a significant association between decreased borrowing for primary and increased borrowing for early childhood education (though not for secondary school).
Figure 3: Increased access to primary schooling is associated with a decline in borrowing for primary education and an increase in borrowing for ECE and secondary education
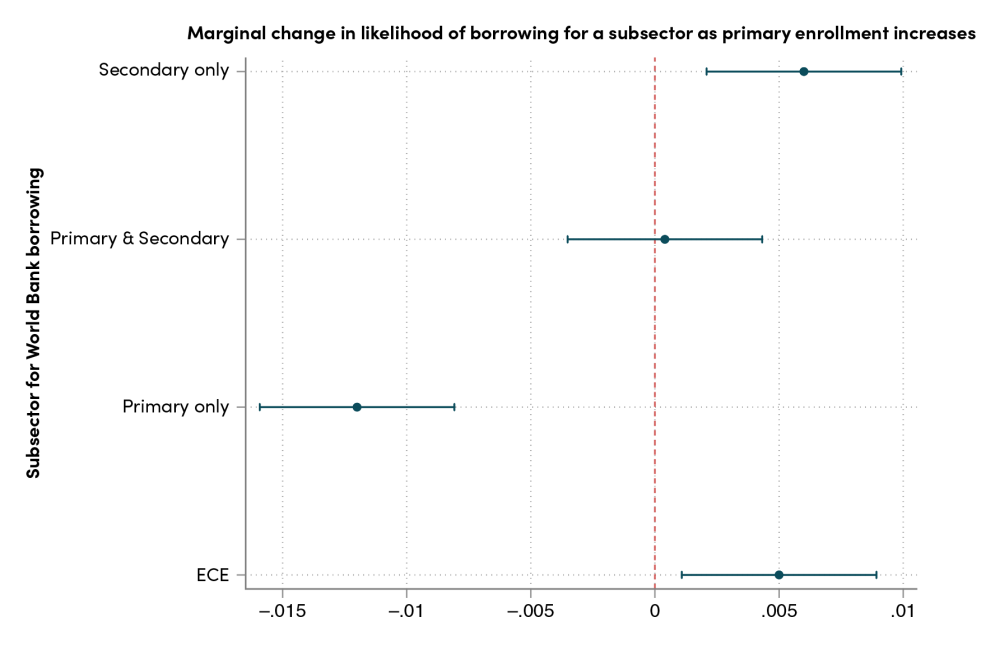
Notes: The bars represent marginal change in likelihood of borrowing for a subsector as primary enrollment increases within a 95 percent confidence interval. Marginal effects are based on a regression controlling for per capita income and country fixed effects. The total number of projects is 395.
The World Bank’s own evaluations suggest it is better at expanding access for younger children than improving learning for older ones
Apart from countries demanding education financing in certain areas, the actual composition of projects is likely to depend on whether the Bank is able to effectively implement those projects. In a perfect world, one might hope that the performance ratings of education projects by the Bank’s Independent Evaluation Group (IEG) could influence allocation decisions in subsequent periods. With that in mind, we used the IEG scores on all education projects completed and evaluated between 1998 and 2021 to examine the relative performance of projects focusing on various objectives and levels of education.
Figure 4: Projects with an explicit focus on learning outcomes are most likely to be rated as unsuccessful.
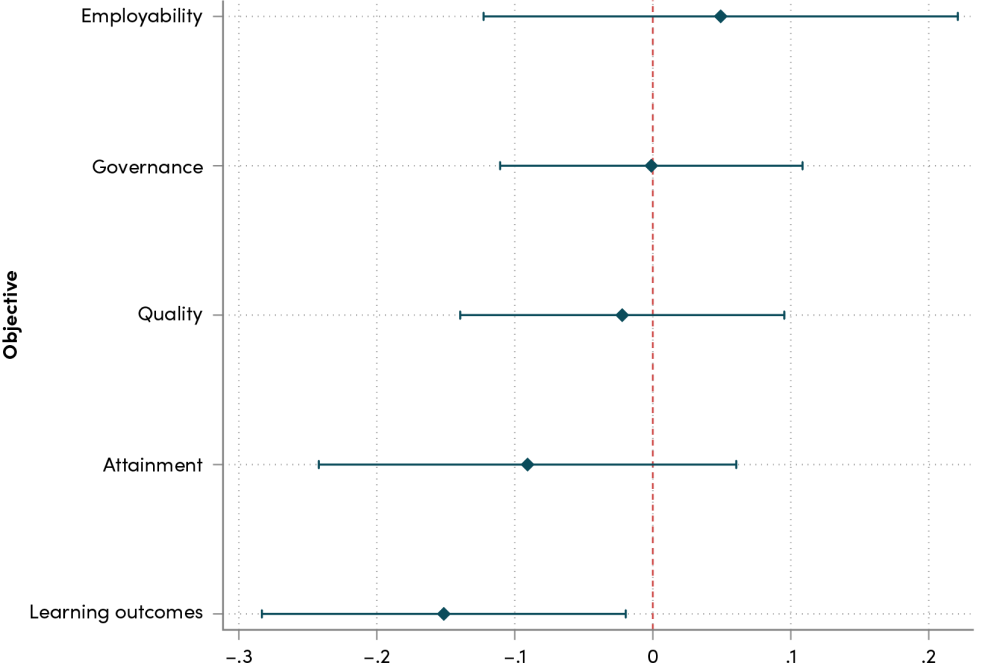
Notes: The bars represent the marginal effects of having a particular objective in a PDO on project outcomes within a 95 percent confidence interval. The regression also controls for the quality of project design and supervision (as rated by IEG), project value, project length, country and year fixed effects.
Using projects focusing on access as a benchmark, we observe that most types of projects exhibit similar average performance, with one notable exception. Projects aimed at improving learning outcomes are 15 percent more likely to receive an unsatisfactory rating than projects on access (Figure 4). A review of the main factors influencing differential ratings among various project types, as outlined in evaluation documents, reveals a pattern: substantiating the attainment of learning outcomes targets proves typically more difficult than achieving access targets over the standard project lifespan. However, our analysis also indicates that the performance gap between access and learning outcomes projects cannot be attributed entirely to monitoring and evaluation quality, suggesting that World Bank projects face more fundamental challenges in improving learning outcomes beyond measurement adequacy.
Figure 5: Early childhood education projects are the only category with a significantly higher probability of success than primary education projects.
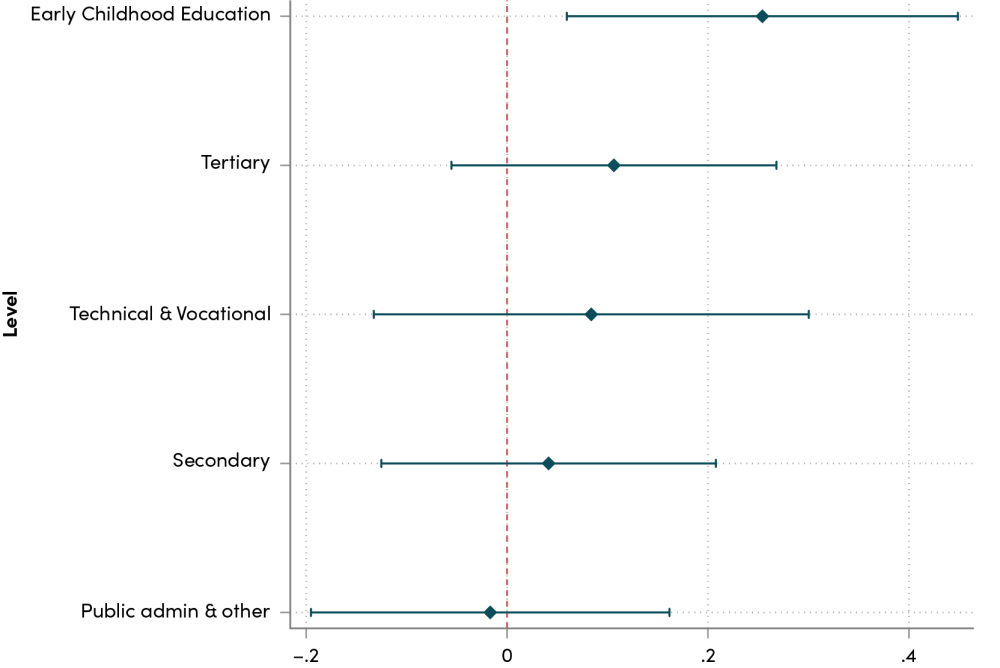
Notes: The bars represent the marginal effects of falling in a particular subsector on project outcomes within a 95 percent confidence interval. The regression also controls for the quality of project design and supervision (as rated by IEG), project value, project length, country and year fixed effects.
On the other hand, when it comes to education subsectors, early childhood education projects stand out as the only category with a significantly higher likelihood of success than primary education projects (Figure 5). More specifically, early childhood education projects have a 25 percent higher probability of receiving a successful rating compared to primary education projects. Part of this variation can be attributed to the fact that most early childhood education projects seek to expand access and World Bank projects are more effective at meeting and measuring access targets.
The stars seem to align on early childhood education
Overall, lending data reveal that the actual evolution of the World Bank’s education portfolio is somewhat different than the public narratives might suggest. The 2011 strategy change did not lead to any pivot from schooling to learning, and despite pledges to the contrary, the share of loans going to primary education actually shrank.
However, the one area where the Bank’s strategy seems to clearly align with the demand from borrowing countries and its own implementation capabilities is early childhood education. Fortunately, that is also an area where there is considerable evidence of impacts on long-term learning outcomes. So while the World Bank mostly failed to reorient its education work toward raising test scores in primary school, it seems to have been gradually increasing its bets on a more feasible strategy to achieve that same goal: getting more kids in preschool.
Disclaimer
CGD blog posts reflect the views of the authors, drawing on prior research and experience in their areas of expertise. CGD is a nonpartisan, independent organization and does not take institutional positions.
Image credit for social media/web: Rattanachat / Adobe Stock