Recommended
Blog Post
Today we launch the Commitment to Development Index 2021 measuring the policy efforts of 40 major economies in supporting development in other countries. The CDI focuses on the development spillover effects of policies in eight component areas: development finance, investment, migration, trade, environment, health, security, and technology. Scores can be “income adjusted” to show how countries perform compared to an expected score based on their income. CGD’s been producing the CDI since 2003, and it remains unique.
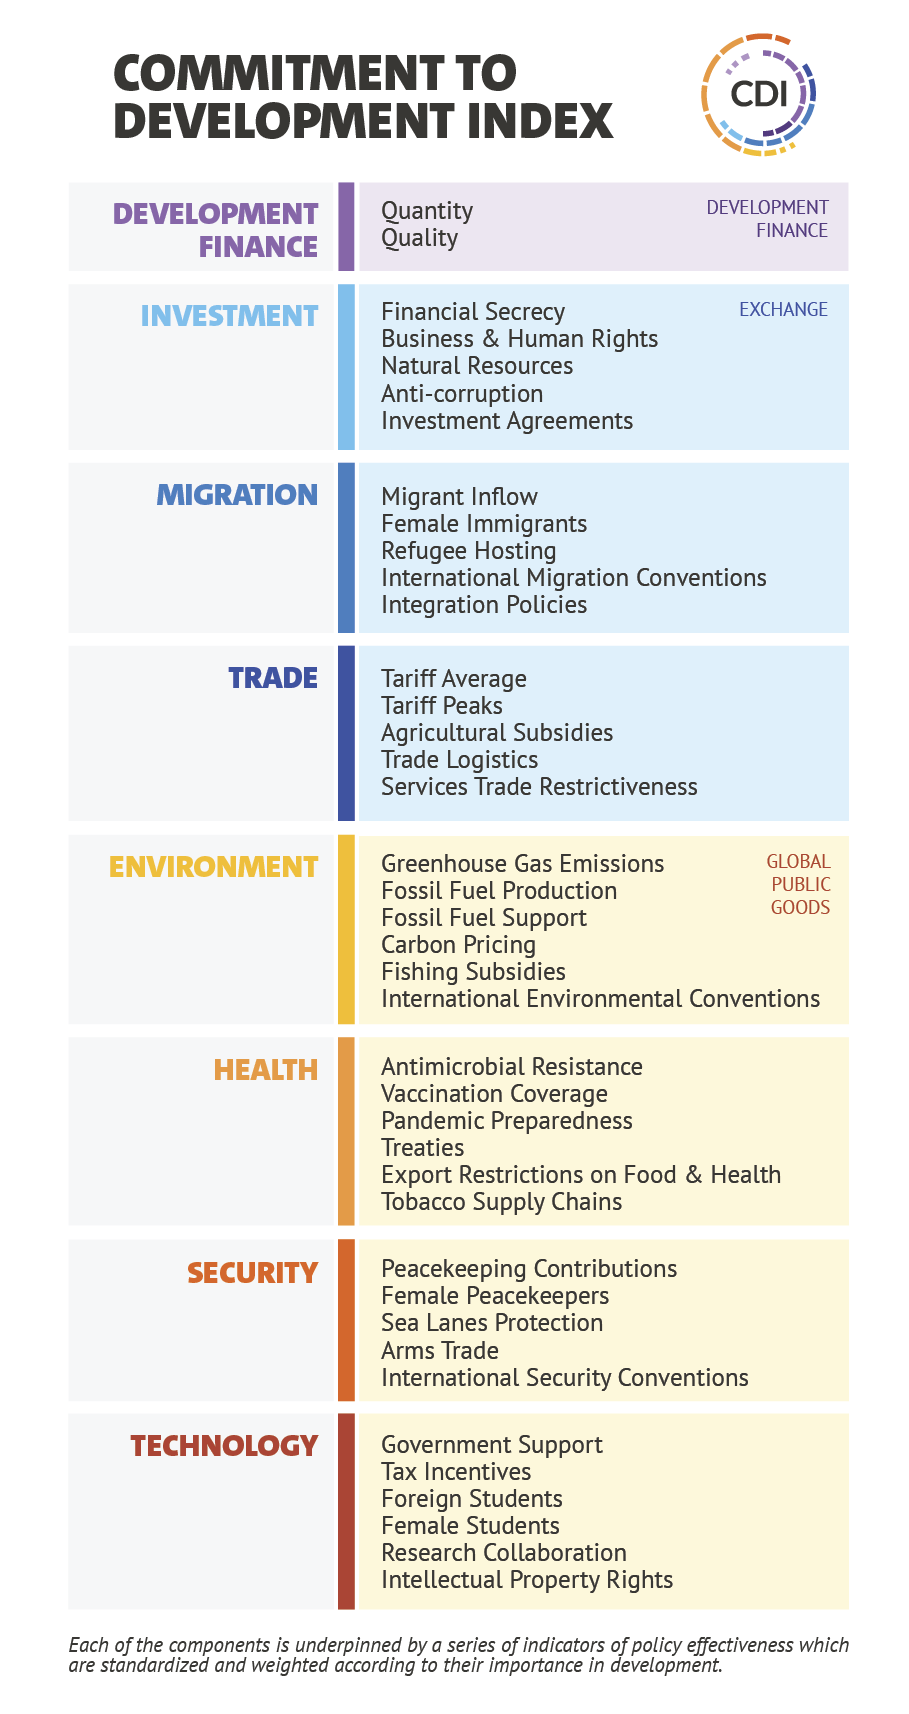
Here are some of the main insights from this year’s CDI (we highlight key environmental findings in more details in an accompanying blog post):
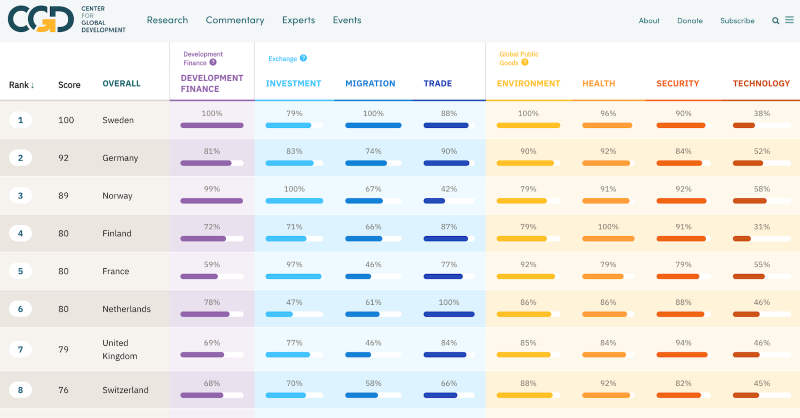
Sweden is top overall, France is 2nd and best in G7, Norway is 3rd, UK is slipping
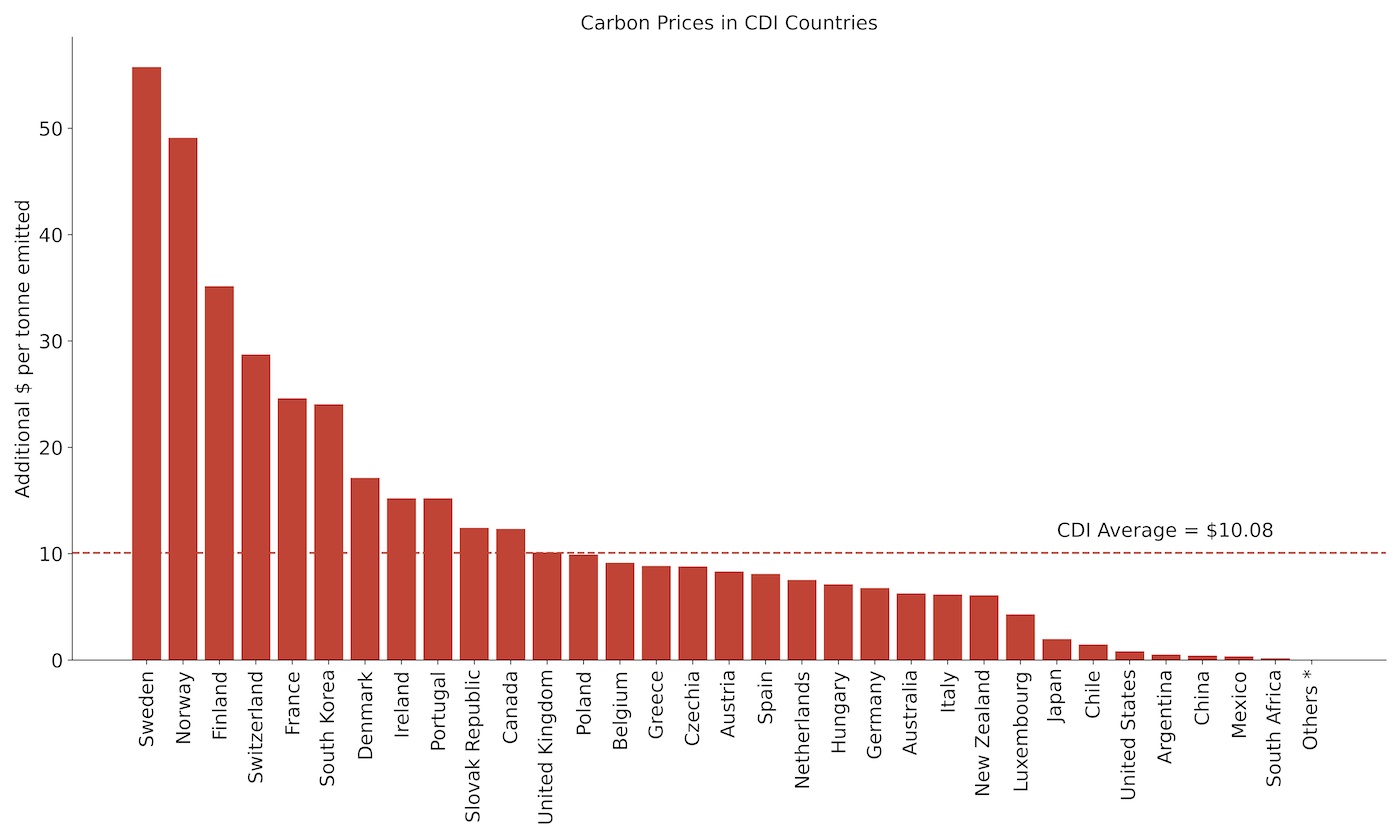
Sweden tops the CDI for the third year in a row. While some might tire of Scandinavian countries dominating international comparisons, the CDI is based on genuine policy effort relative to country size—and Sweden’s policies in many areas offer insights. In particular, Sweden’s direct emissions are just 5 tonnes per head, half the CDI average, a feat achieved partly through a high carbon price. Sweden is also a leader on migration both in terms of refugee hosting and migrant integration (though even Sweden could improve on technology, where foreign students and research collaborations with lower-income countries are less-common than for others. Norway takes 3rd position and mirrors Sweden’s strengths on the high quantity and quality of development finance and migration leadership. Trade is Norway’s Achilles’ heel, with its high agricultural subsidies and trade tariffs, and its environmental performance is held back by the highest fossil fuel production per head of any country we assess.
France is the top G7 country and ranks 2nd—it scores strongly on investment standards and on environmental policy. However, while France’s development finance is (just) in the top third in terms of volume, it is in the bottom-half of countries on quality, where its efforts are not as focussed as other CDI countries on fragility and poverty. In both cases, the French government has legislated to make improvements.
Moving the other way is the UK—its rank slipped a place to 5th but its cut in official development assistance (ODA) from 0.7 percent to 0.5 percent is not yet reflected in the official data we use in constructing the CDI. This will damage its ranking in future editions, especially if its “tilt to the Asia-Pacific” means less fragility and poverty focus. Still, the UK’s post-Brexit trade policy has lowered tariffs for some middle-income countries, and improved its trade score. But the UK is firmly in the bottom half on migration, and its pandemic export restrictions on health products (see below) meant a middling performance on its contribution to global health.
New global health leadership
While COVID-19 and its economic fallout are still major issues, we’ve been looking at what countries are doing more broadly with an entirely new component assessing health contribution. It includes indicators of disease prevention, antimicrobial resistance, international collaboration, and avoiding policies which stifle trade in health- and food-related goods. As ever in the CDI, we focus on non-aid policies (multilateral contributions and all cross-border aid is captured in the development finance component, and we also measure R&D support in the technology component).
Finland tops the new health component, ahead of Sweden, with Japan taking third spot. Each scores well on limiting antimicrobial resistance. Australia and Saudi Arabia complete the top 5 on health. This performance on health boosted these countries overall ranking by at least 4 places (except Sweden, who were already top), with Australia ranking 4th overall.
New to the CDI this year—and particularly relevant during a pandemic—is an indicator looking at the breadth and duration of export restrictions on health-related goods. It draws on Global Trade Alert data to look at goods including personal protective equipment, masks, pharmaceuticals, and medical equipment, as well as on food (less of an issue during the COVID pandemic but a problem in food price spikes). This shows widely reported export bans India has implemented, but also highlights that many others (especially Brazil, Norway, Argentina, and the UK) have been restricting chunks of their exports. These restrictions undermine the ability of trade partners to fight COVID and are a symptom of poor planning and preparedness.
Figure 1. New restrictions of food and health products (Jan 2020 to mid-June 2021)
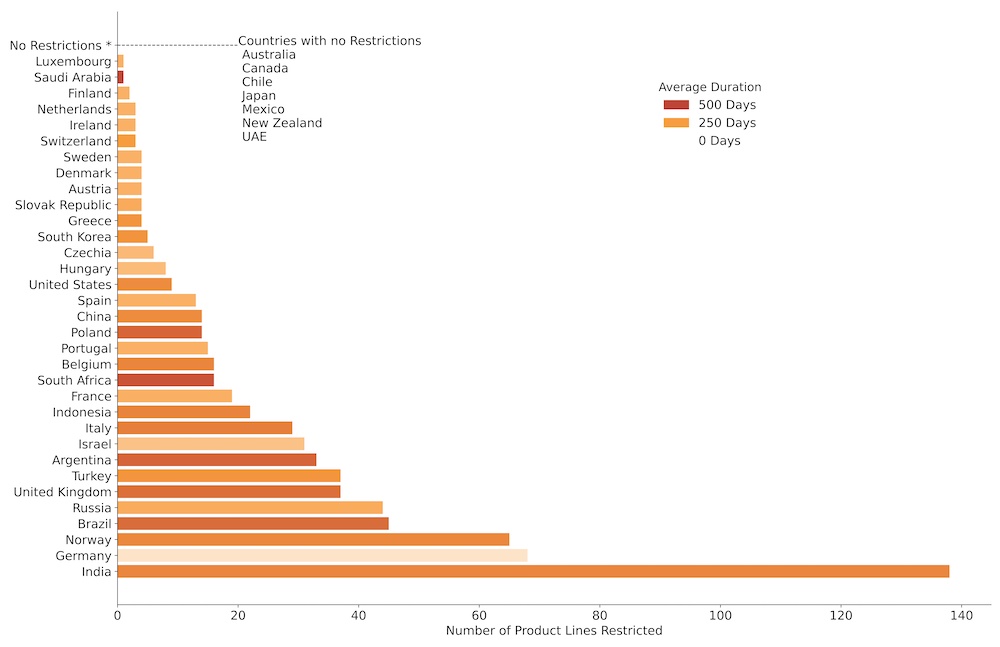
Source: CGD analysis of Global Trade Alert data
The EU far ahead of US on development; China lags both
The CDI confirms the strength of European countries in development. EU countries take 6 of the top 10 positions with policies that are doing far more for collective development than those of the other major economies of China and the US.
The US has slipped four places to 22nd as Trump-era policies feed into the CDI’s source data, though US performance has long struggled in our framework. The US scores strongly on security, with outsized efforts on protecting sea lanes. And while US officials have argued this deserves more credit, it’s hard to see the US as a development leader with its greenhouse gas emissions per head at twice the CDI average; its development finance as a share of its income well below the average; and its unwillingness to sign international agreements in the fields of security, health, and the environment.
China ranks 36th overall on the CDI. This partly reflects that China’s income level was just under $17,000 per head in 2019 (adjusted for purchasing power), roughly a quarter of the US’s $66,000. Still, China’s performance lags Brazil, Indonesia, and South Africa, despite their lower income levels. When we income-adjusted the CDI results, China rises five places but remains in the bottom quarter. Much attention has, understandably, been given to its Belt and Road Initiative, but in terms of the finance, this is remarkably cheap to provide (Charles Kenny and I have wondered why others don’t copy it). And the CDI also ranks China poorly on the quality of its finance, not only on transparency but also on poverty focus and tying its support to Chinese contractors.
Even China’s wider policy set is doing little for global development: it exports a relatively large amount of arms, and more of these go to conflict prone (poor, militaristic, and undemocratic) countries than is the case for most CDI countries (only UAE’s are more conflict-prone; with India, Canada, and Russia also in the bottom five). China records (and likely accepts) very few migrants or refugees, and its climate profile is in the bottom half of countries we assess, with high coal production and so-far limited pricing of carbon.
Where next on commitment to development?
With President Biden declaring that the US “is back” on international issues, President Xi Jinping aiming for net zero emissions by 2060, and President Macron saying that “fighting against global inequalities has always been in France's DNA,” the CDI stands out as an evidence-based test of whether policy commitment to internationalism follows the rhetoric. We hope you will use it to understand, challenge, and improve your country’s policies.
Disclaimer
CGD blog posts reflect the views of the authors, drawing on prior research and experience in their areas of expertise. CGD is a nonpartisan, independent organization and does not take institutional positions.
Image credit for social media/web: Center for Global Development