Recommended
Recent news that developed countries may finally have delivered on their promise to mobilise $100 billion of climate finance is welcome. But this is nowhere near enough, and climate finance will continue to be an extremely contentious issue at COP28 in Dubai. So, how much should there be?
The original $100 billion per annum climate finance pledge (first mooted in 2009 by then UK Prime Minister Gordon Brown, and agreed to at COP15 in Copenhagen) was not based on any costed programme or assessment of need, but negotiated as part of wider attempts to secure a climate deal. It was much less than developing countries were seeking at the time. And it has rankled ever since, particularly as around only half of even what has been delivered is actually new money.
This blog briefly reviews estimates of climate finance based on three different approaches: financing needs, liability, and justice. But whichever approach is used, it’s time to think much, much bigger.
Climate finance needs
Numerous attempts have since been made to quantify climate finance needs. But this is difficult and estimates vary widely. Take, for example, the UNFCCC’s summary of developing country financing needs produced by the Standing Committee on Finance. This suggests that costed needs expressed in each country’s NDC (the ‘Nationally Determined Contributions’ document that sets out climate action plans) amount to just under $6 trillion to 2030, or about $600 billion each year. Around 80 percent of this might require international sources of finance. But that latter figure is based on only about 10 percent of costed needs actually identifying whether international or domestic finance is required. And only about 40 percent of identified needs in NDCs are actually costed. Moreover, figures in other key documents—notably the ‘National Communications’ and the ‘Biennial Update Reports’—are significantly higher, even though smaller proportions of needs are costed.
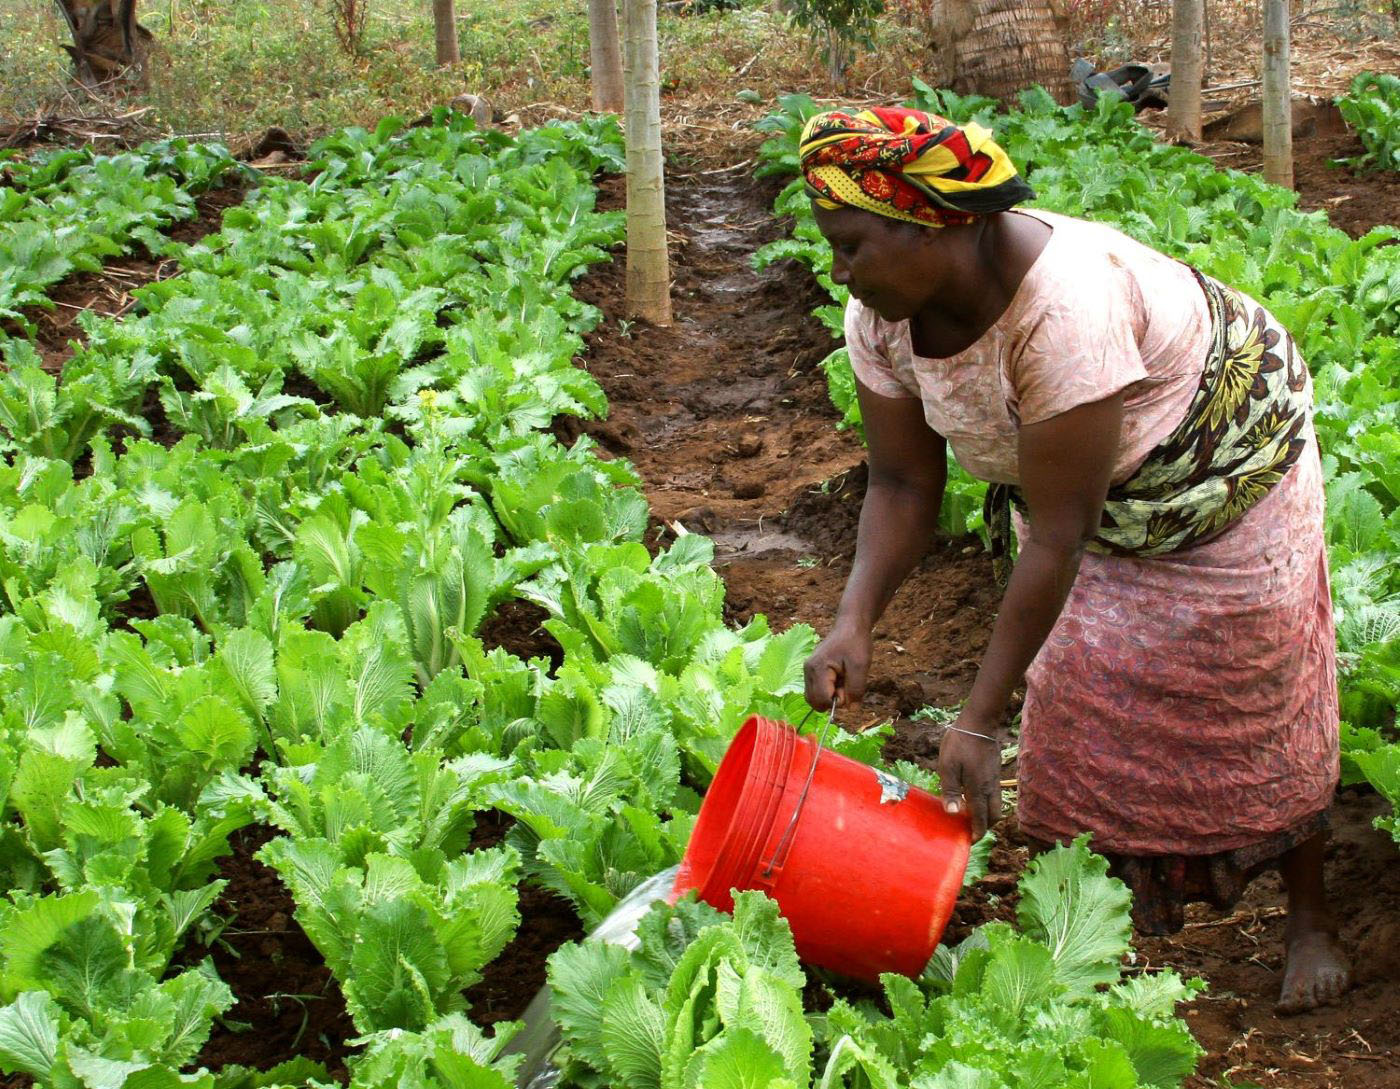
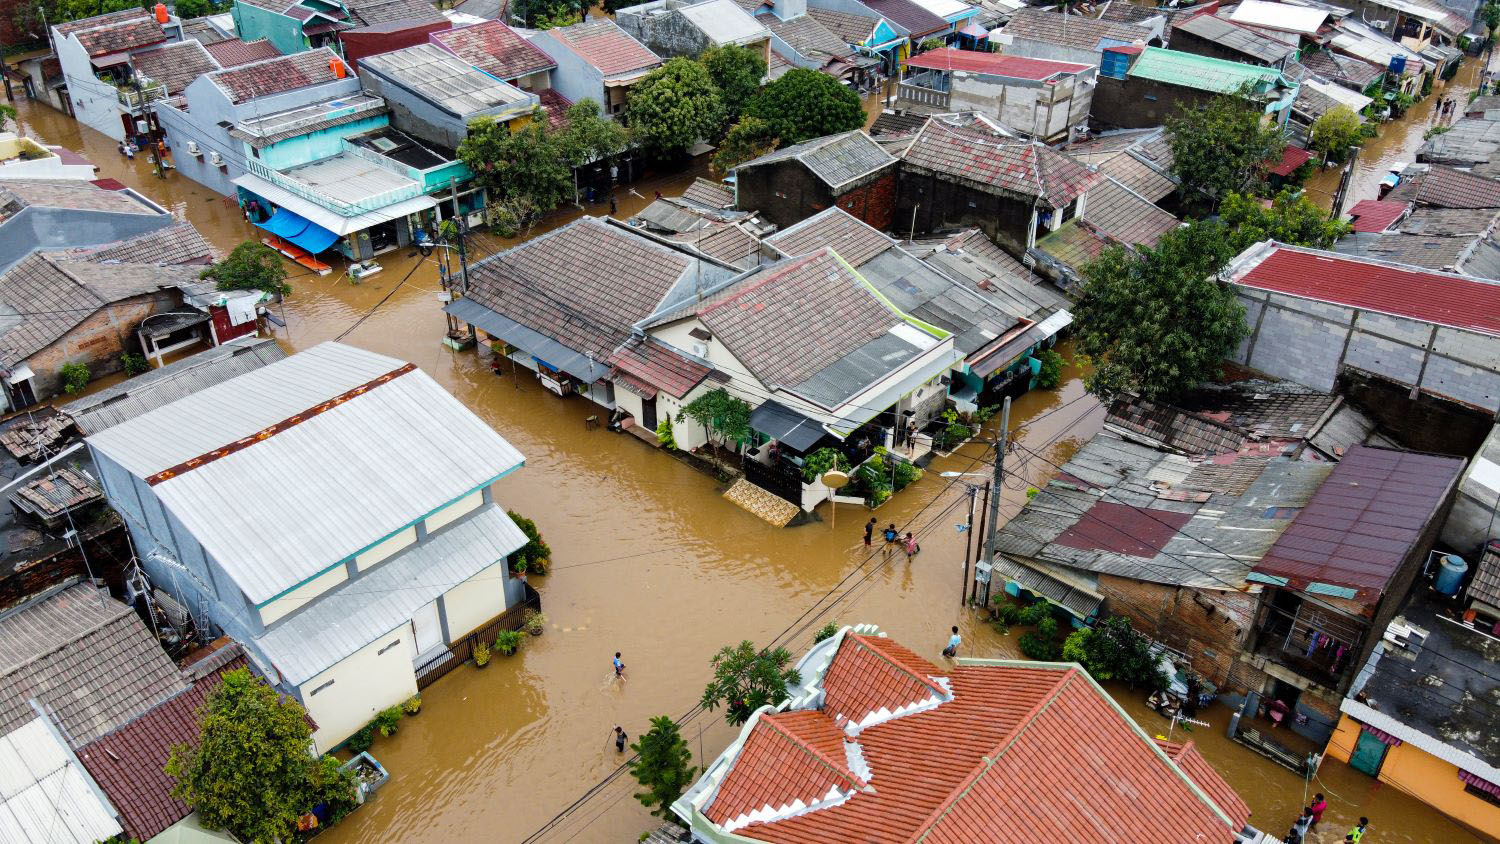
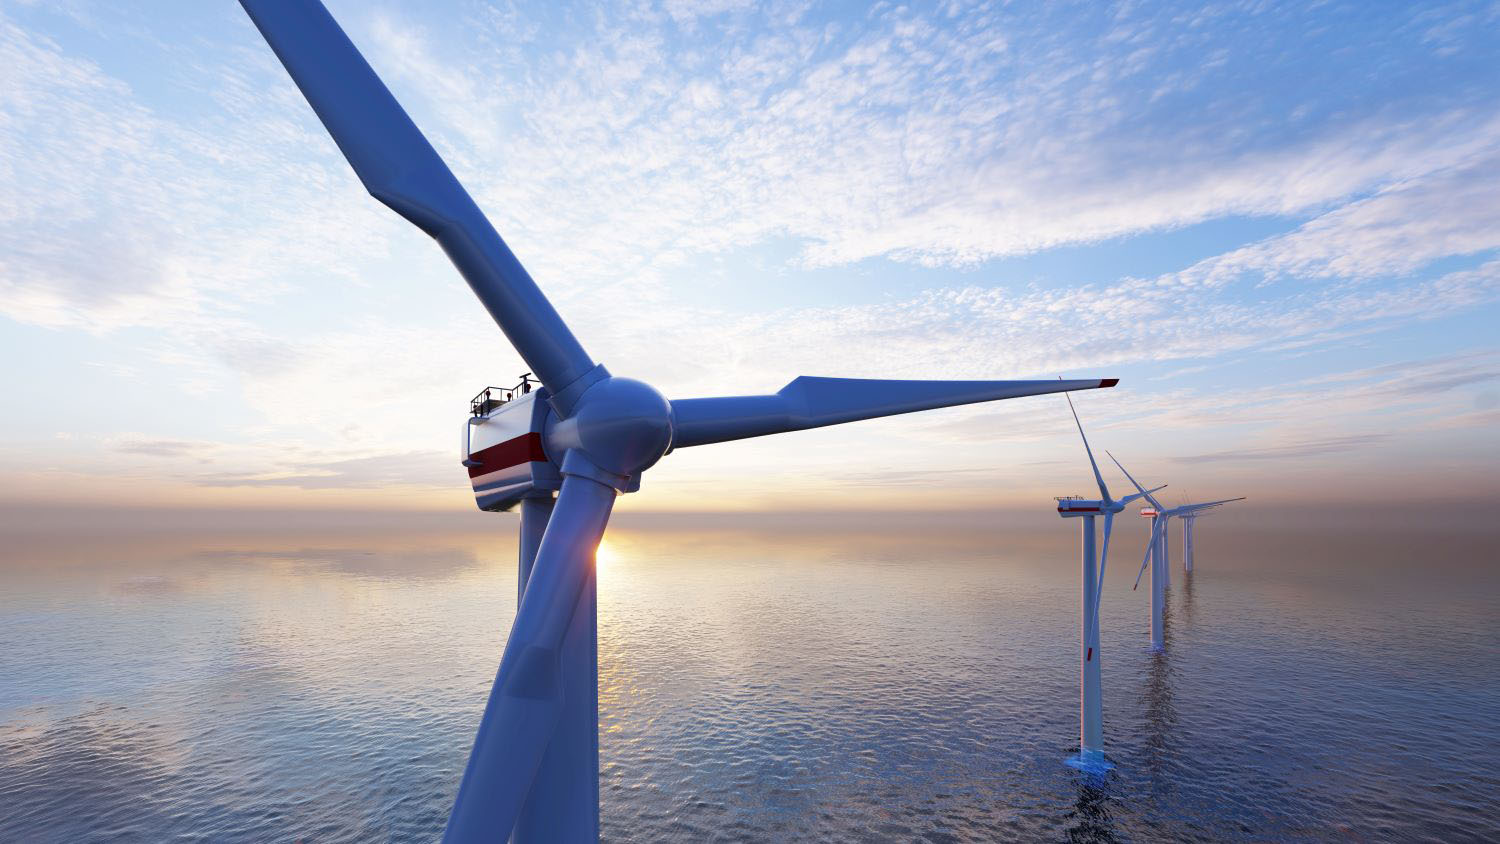
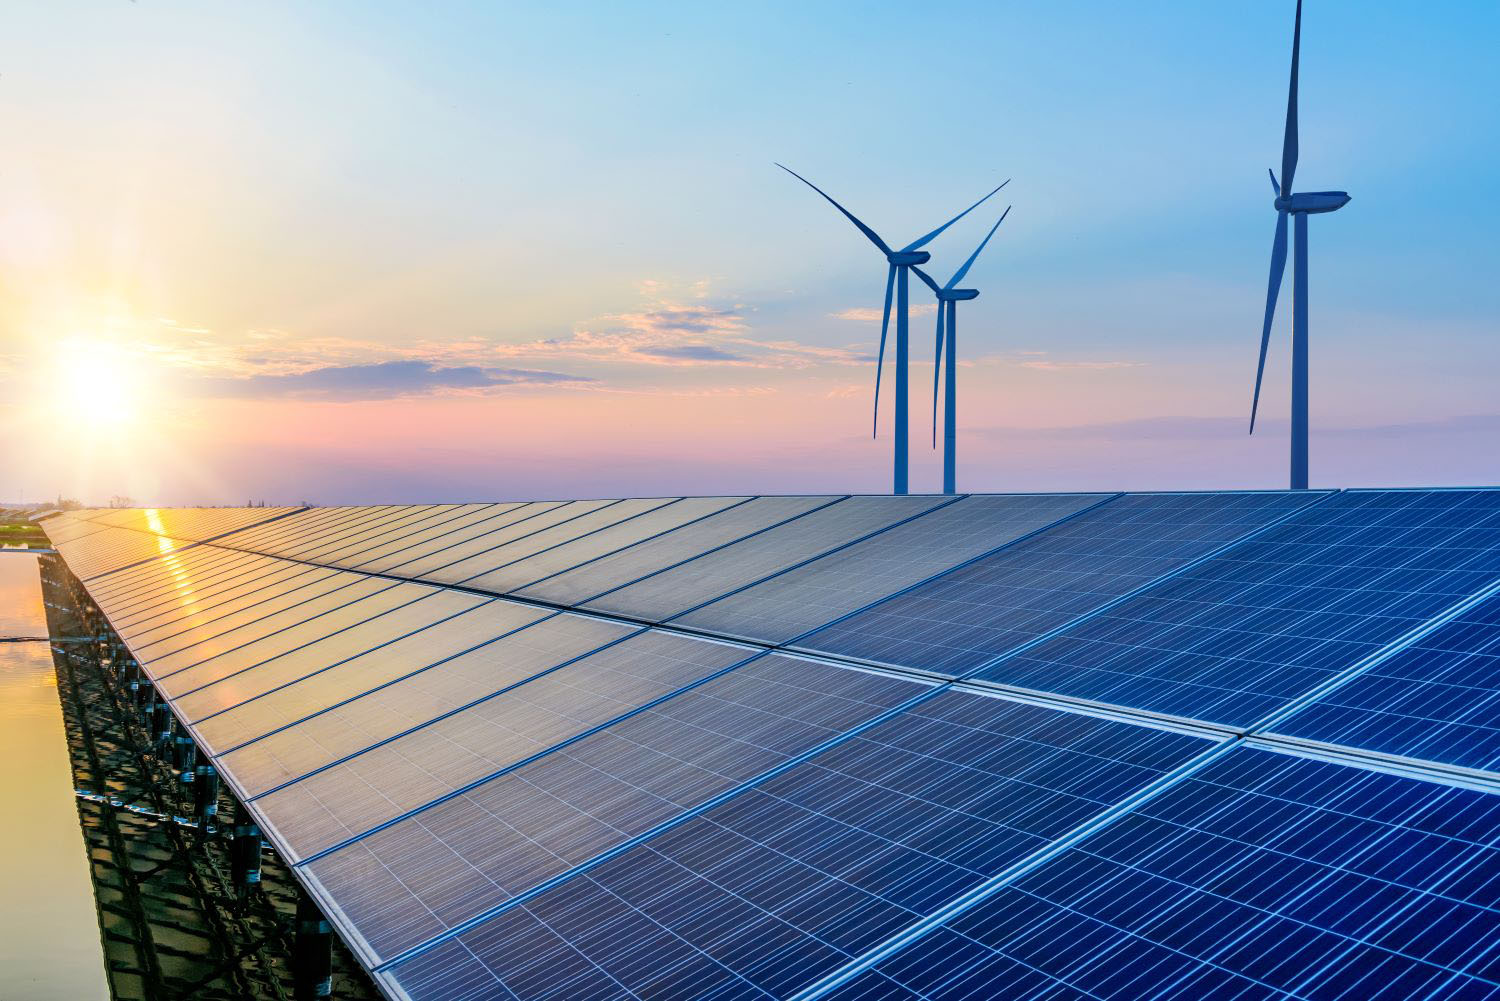
Last year’s Report of the Independent High-Level Expert Group on Climate Finance, arguably the most authoritative and influential assessment, concluded that emerging markets and developing countries other than China will need to spend around $2.4 trillion per year by 2030 (6.5 percent of their GDP) to meet mitigation and adaptation investment needs in line with the Paris Agreement. These financing needs cover the costs of energy transformation ($1.3-1.7 trillion), loss and damage ($200-400 billion), adaptation and resilience ($200-250 billion, though UNEP have since increased these estimates to $215-387 billion), and natural capital ($275-400 billion). Not all is additional: at least half the energy figures will be required anyway to meet wider development objectives. And about half could come from domestic sources, leaving external financing needs (to be met by both public and private sources) of around $1 trillion per annum by 2030. The report was at pains to stress that this is not the new $100 billion goal, but a requirement based on an analysis of the investment necessary and the domestic finance potentially available, for an internationally agreed and vital purpose.
Historic liabilities
Another approach is to quantify the debt associated with climate damages caused by CO2 emissions. This study does so by applying a social cost of carbon($51/tCO2, as currently used by the US government for appraising the environmental impact of policy and investment choices, discounted by 3 percent for each year prior to 2020) to global cumulative emissions since 1979. It estimates these climate liabilities to be $34 trillion in total, with OECD countries accounting for $15 trillion. If this approach was used to set climate finance goals (although some of these damages will be incurred within the OECD), OECD countries would need to contribute $190 billion a year to 2100. That figure would double to $390 billion per year with alternative assumptions that are less favourable to developed countries (a higher social cost of carbon of $76/tCO2, a lower discount rate of 2.5 percent, and no cut-off date), and to over $900 billion a year if damages were not discounted at all (discounting has proved controversial in the literature).
Even that may be an underestimate. While the social cost of carbon figures are within the $40-$80/tCO2 range for 2020 recommended back in 2017 by the High Level Commission on Carbon Pricing, more recent analysis suggests those carbon prices should be even higher. This study advocates $185/tCO2, a figure that the US government is reported to be preparing to apply. The UK government has already adopted a 2020 value of £241/tCO2 (c. $300/tCO2), based on IPCC assessments of carbon values consistent with limiting temperature increases to 1.5⁰C. Using these values (but retaining a 1979 cut-off and 3 percent discount rate), OECD climate liabilities would rise to $55 trillion (at $185/tCO2) and $90 trillion (at $300/tCO2), with annual climate finance contributions through to 2100 of $700 billion and $1.1 trillion respectively. Remove both cut-off date and discounting, and those numbers rise further to $2.2 trillion and $3.6 trillion respectively. As a debt, they should be repaid in grants, not loans. Moreover, these climate damages, and hence debts, are rising with each year that passes, although as noted above, some of these damages will be incurred within the OECD, and as noted previously, there is a strong case for other countries to start contributing.
A justice approach
Another way of looking at it is through the lens of climate justice, based on equal per capita emissions. That is, if above average emitters had to pay below average ones based on the value of carbon, how much would the payments be? Current patterns of emissions are very far from equal. Average annual per capita CO2 emissions are about 4.6 tonnes per head globally, but differ markedly by country income group, with per capita emissions in high (10.2) and upper middle income (6.8) countries well above those in lower middle (1.8) and low income (0.3) countries. See figure below, which also uses data on the population of each income group to show the total emissions from each. This unequal consumption of a global ‘carbon budget’ effectively represents an annual transfer from poor to rich countries.
We can value this transfer by multiplying the difference between actual and ‘equal’ emissions in LICs and LMICs (their volume of emissions had they also consumed the global average of 4.6 tCO2/hd) by a carbon price. Using the 2017 High Level Commission on Carbon Pricing’s recommended values of $40-$80/tCO2 in 2020, this works out at an annual transfer from low/lower middle to upper middle/high income countries of c.$500 billion - $1 trillion. Using carbon values of $185/tCO2 and $300/tCO2 referred to above, those figures rise to $2.3 and $3.7 trillion respectively. To put that in perspective, the total value of fishing in international waters (a ‘common resource’ analogous in some ways to a global carbon budget) was just $7.6 billion in 2014, of which the vast majority fished by HIC/UMIC fishing vessels.
Global CO2 emissions by income group

Source: Our World in Data (updated with 2021 data).
Are trillions in transfers realistic?
In 2022, the rich world provided $175bn per year of official assistance to lower income countries based on ODA figures (less if refugee costs are excluded). A figure of $1 trillion is equal to six times this level of finance annually. Whilst politically this may be difficult to imagine, the significance of climate impacts, and the need to bind countries into a deal to take a different emissions pathway, means a new mindset is needed on climate finance volumes. $1 trillion represents about 1 percent of global income, and 1.7 percent of OECD income. The responses to COVID (with some $17 trillion committed globally by September 2021) and the war in Ukraine (with around $260 billion committed up to July 2023) demonstrate that large sums can be found when emergencies strike. And the US has spent $2.3 trillion on the war in Afghanistan over the period 2001-2022.
Conclusion: an inconvenient truth
Whichever way you look at it, climate finance should be many times higher than it is now. And it should be additional to, not displace, existing development assistance, with some advocating one target combining both. Yes, budgets are tight. Yes, there are other pressing priorities too. But if we can dig deep for wars and pandemics, we can dig deep for climate change. It is of course emissions cuts, not climate finance, that will ultimately drive the trajectory of global warming and associated economic and social costs. But climate finance will help accelerate that ambition. The time for incrementalism is over. We need big, bold commitments. And we need them now.
With thanks to Ian Mitchell for comments on an earlier draft, and to Ed Wickstead for creating the chart. All views and any errors remain those of the author.
Disclaimer
CGD blog posts reflect the views of the authors, drawing on prior research and experience in their areas of expertise. CGD is a nonpartisan, independent organization and does not take institutional positions.
Image credit for social media/web: Adobe Stock