
A central commitment of action on climate is the promise of “developed countries” to jointly mobilize $100 billion of climate finance per year by 2020 (and through to 2025). How does this promise—which developed countries have so far failed to reach—compare to the actual cost of the damage caused by their emissions?
Today we publish a paper that answers that question by estimating the liability each country bears for the costs of damage caused by carbon emissions to date. We limit this liability with two assumptions. First, we only count damage from when international awareness of climate issues grew. Second, we reduce the cost applied to older emissions. These limitations are arguably conservative—and we consider other scenarios in the paper.
Under our main scenario, the total liability amounts to around 40 percent of world GNI. For developed OECD countries, the collective liability is $15.2 trillion, which equates to $190 billion per year if paid off to 2100. Even under relatively conservative assumptions then, the climate finance promise falls far short of liabilities to date. We also note that countries not part of the $100 billion pledge—notably China and Russia—have built up substantial liability. Below, we describe the key assumptions, and set out the country-by-country results.
How liable are countries for climate damage?
At the heart of climate change is the problem that carbon use generates emissions which damage the climate. Economists have long attempted to estimate the economic damage of each additional tonne of carbon emitted—a measure known as “the social cost of carbon.” Recent authoritative estimates suggest these costs may now be between $14 to $76 per tonne; for our analysis, we use a figure of $51 per tonne for 2020.
There is a case to be made for a single carbon cost through history, which we discuss in the paper, but in our main scenarios, we argue that, in line with recent papers, the social cost of more recent (and future) emissions are higher; we are not suggesting later carbon emissions are more physically damaging than earlier ones, but that they do more socio-economic damage. So, we score 2020 emissions at $51 per tonne, but discount older emissions by 3 percent per year.
When did the clock start on responsibility for climate damage?
We also argue that countries should not be liable for the social costs of their carbon emissions before there was general awareness of the damaging nature of those emissions. While this approach does not necessarily align with a legal definition of “liability,” we feel it is defensible; when societies were using fossil fuels to develop their economies, and in ignorance of their harmful effects, they were doing so in good faith.
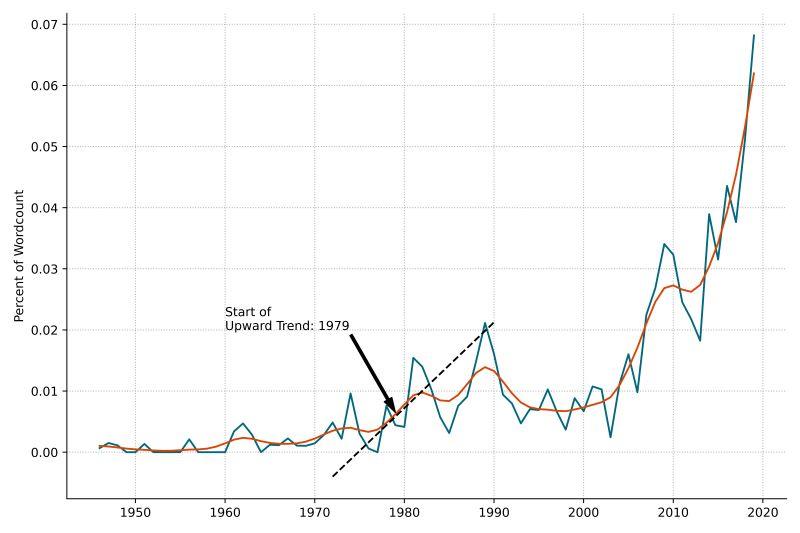
To identify a specific year from which countries should be held responsible for the social cost of their emissions, we examine the frequency with which world leaders at the UN General Assembly meetings refer to climate-related issues, and pinpoint 1979 as the year that a sustained increase in climate matters took hold (Figure 1). This is also the year that Nathaniel Rich pinpoints as the time we knew nearly all we do now about climate change in his historical survey of the subject, Losing Earth; it also coincides with the first World Climate Conference of the World Meteorological Organization.
Figure 1. Frequency of climate related terminology at UNGA meetings, 1949-2019
What are the liabilities?
In our main scenario, the carbon liability of the world is $34.2 trillion, or around 40 percent of world GNI. Of course, this is unevenly distributed, as different countries have emitted more, or done so more recently when our social cost of carbon was higher because economic systems are already under strain from carbon pollution. The collective liability of OECD countries (which aligns broadly with “developed countries” in the $100 billion agreement) is about 44 percent of the total at $15.2 trillion. Paid off annually to 2100, this amounts to $190 billion per year, suggesting that even under the relatively forgiving assumptions of our main scenario, the value of that liability is well-above—indeed, almost double—commitments made on climate finance.
We calculate the liability for all countries for which we have data in our paper, but present a selection in figure 2, in total and on a per head basis.
Figure 2. Carbon liability for selected countries and groupings, total and per capita
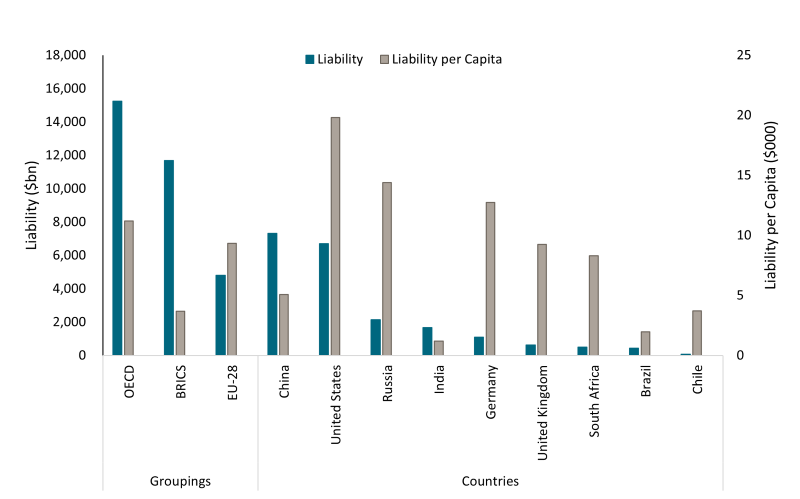
Importantly, it is not just rich countries who would share the burden. China’s liability is $7 trillion, slightly more than the US’s, which is $6.5 trillion, although in per capita terms these liabilities are around $5,000 and $20,000 respectively. The BRICS countries collectively owe almost as much as the OECD, $11.6 trillion, though they are more populous, so this translates to just $3,600 per capita.
We do not look at which countries these liabilities are due to, though a portion may be “owed” to the emitting country itself, rather than just internationally. We also limit our analysis to carbon-based emissions, rather than all greenhouse gases given data limitations.
We present only the main scenario here, but the full paper presents two alternative scenarios. One with more relaxed assumptions (a lower carbon price and higher discount rate) and one with more conservative assumptions (a higher price, a lower discount rate, and no cutoff). We also discuss the politics of liabilities and a framework for negotiation that takes note of capacity to pay. We also publish the model that drives these results so that users may update the social cost of carbon and other assumptions.
Post-2025: Beyond $100 billion and beyond “developed” countries
The climate finance goal of $100 billion is not based on liabilities. Still, liabilities are relevant for considering the transfer of resources from industrialised countries to lower-income ones that are being asked to take a costly low carbon growth path but have barely contributed to climate damage.
The magnitude of our relatively conservative central scenario—$190 billion per year—is relevant to the post-2025 target for climate finance. Furthermore, countries like China and Russia are also substantially liable for climate damage and should be contributing to climate finance goals beyond 2025.
For more details on our model and analysis, be sure to read the full paper.
Table 1. Carbon liabilities for selected countries and groupings (carbon cost of $51/tonne)
| Country | Liability ($bn) | Share of Total Debt | Liability per Capita | Liability / GNI |
|---|---|---|---|---|
| World | 34,218 | 100% | 4,459 | 39.0% |
| China | 7,096 | 20.7% | 5,077 | 49.8% |
| United States | 6,505 | 19.0% | 19,818 | 30.0% |
| Russia | 2,081 | 6.1% | 14,412 | 126.4% |
| India | 1,621 | 4.7% | 1,186 | 57.1% |
| Germany | 1,058 | 3.1% | 12,729 | 26.7% |
| United Kingdom | 618 | 1.8% | 9,242 | 22.2% |
| South Africa | 485 | 1.4% | 8,288 | 142.1% |
| Brazil | 416 | 1.2% | 1,969 | 23.2% |
| Chile | 70 | 0.2% | 3,717 | 26.0% |
| OECD | 15,242 | 44.5% | 11,207 | 28.2% |
| EU-28 | 4,804 | 14.0% | 9,340 | 26.0% |
| BRICS | 11,698 | 34.2% | 3,681 | 56.1% |
Disclaimer
CGD blog posts reflect the views of the authors, drawing on prior research and experience in their areas of expertise. CGD is a nonpartisan, independent organization and does not take institutional positions.
Image credit for social media/web: Adobe Stock