Recommended

Blog Post
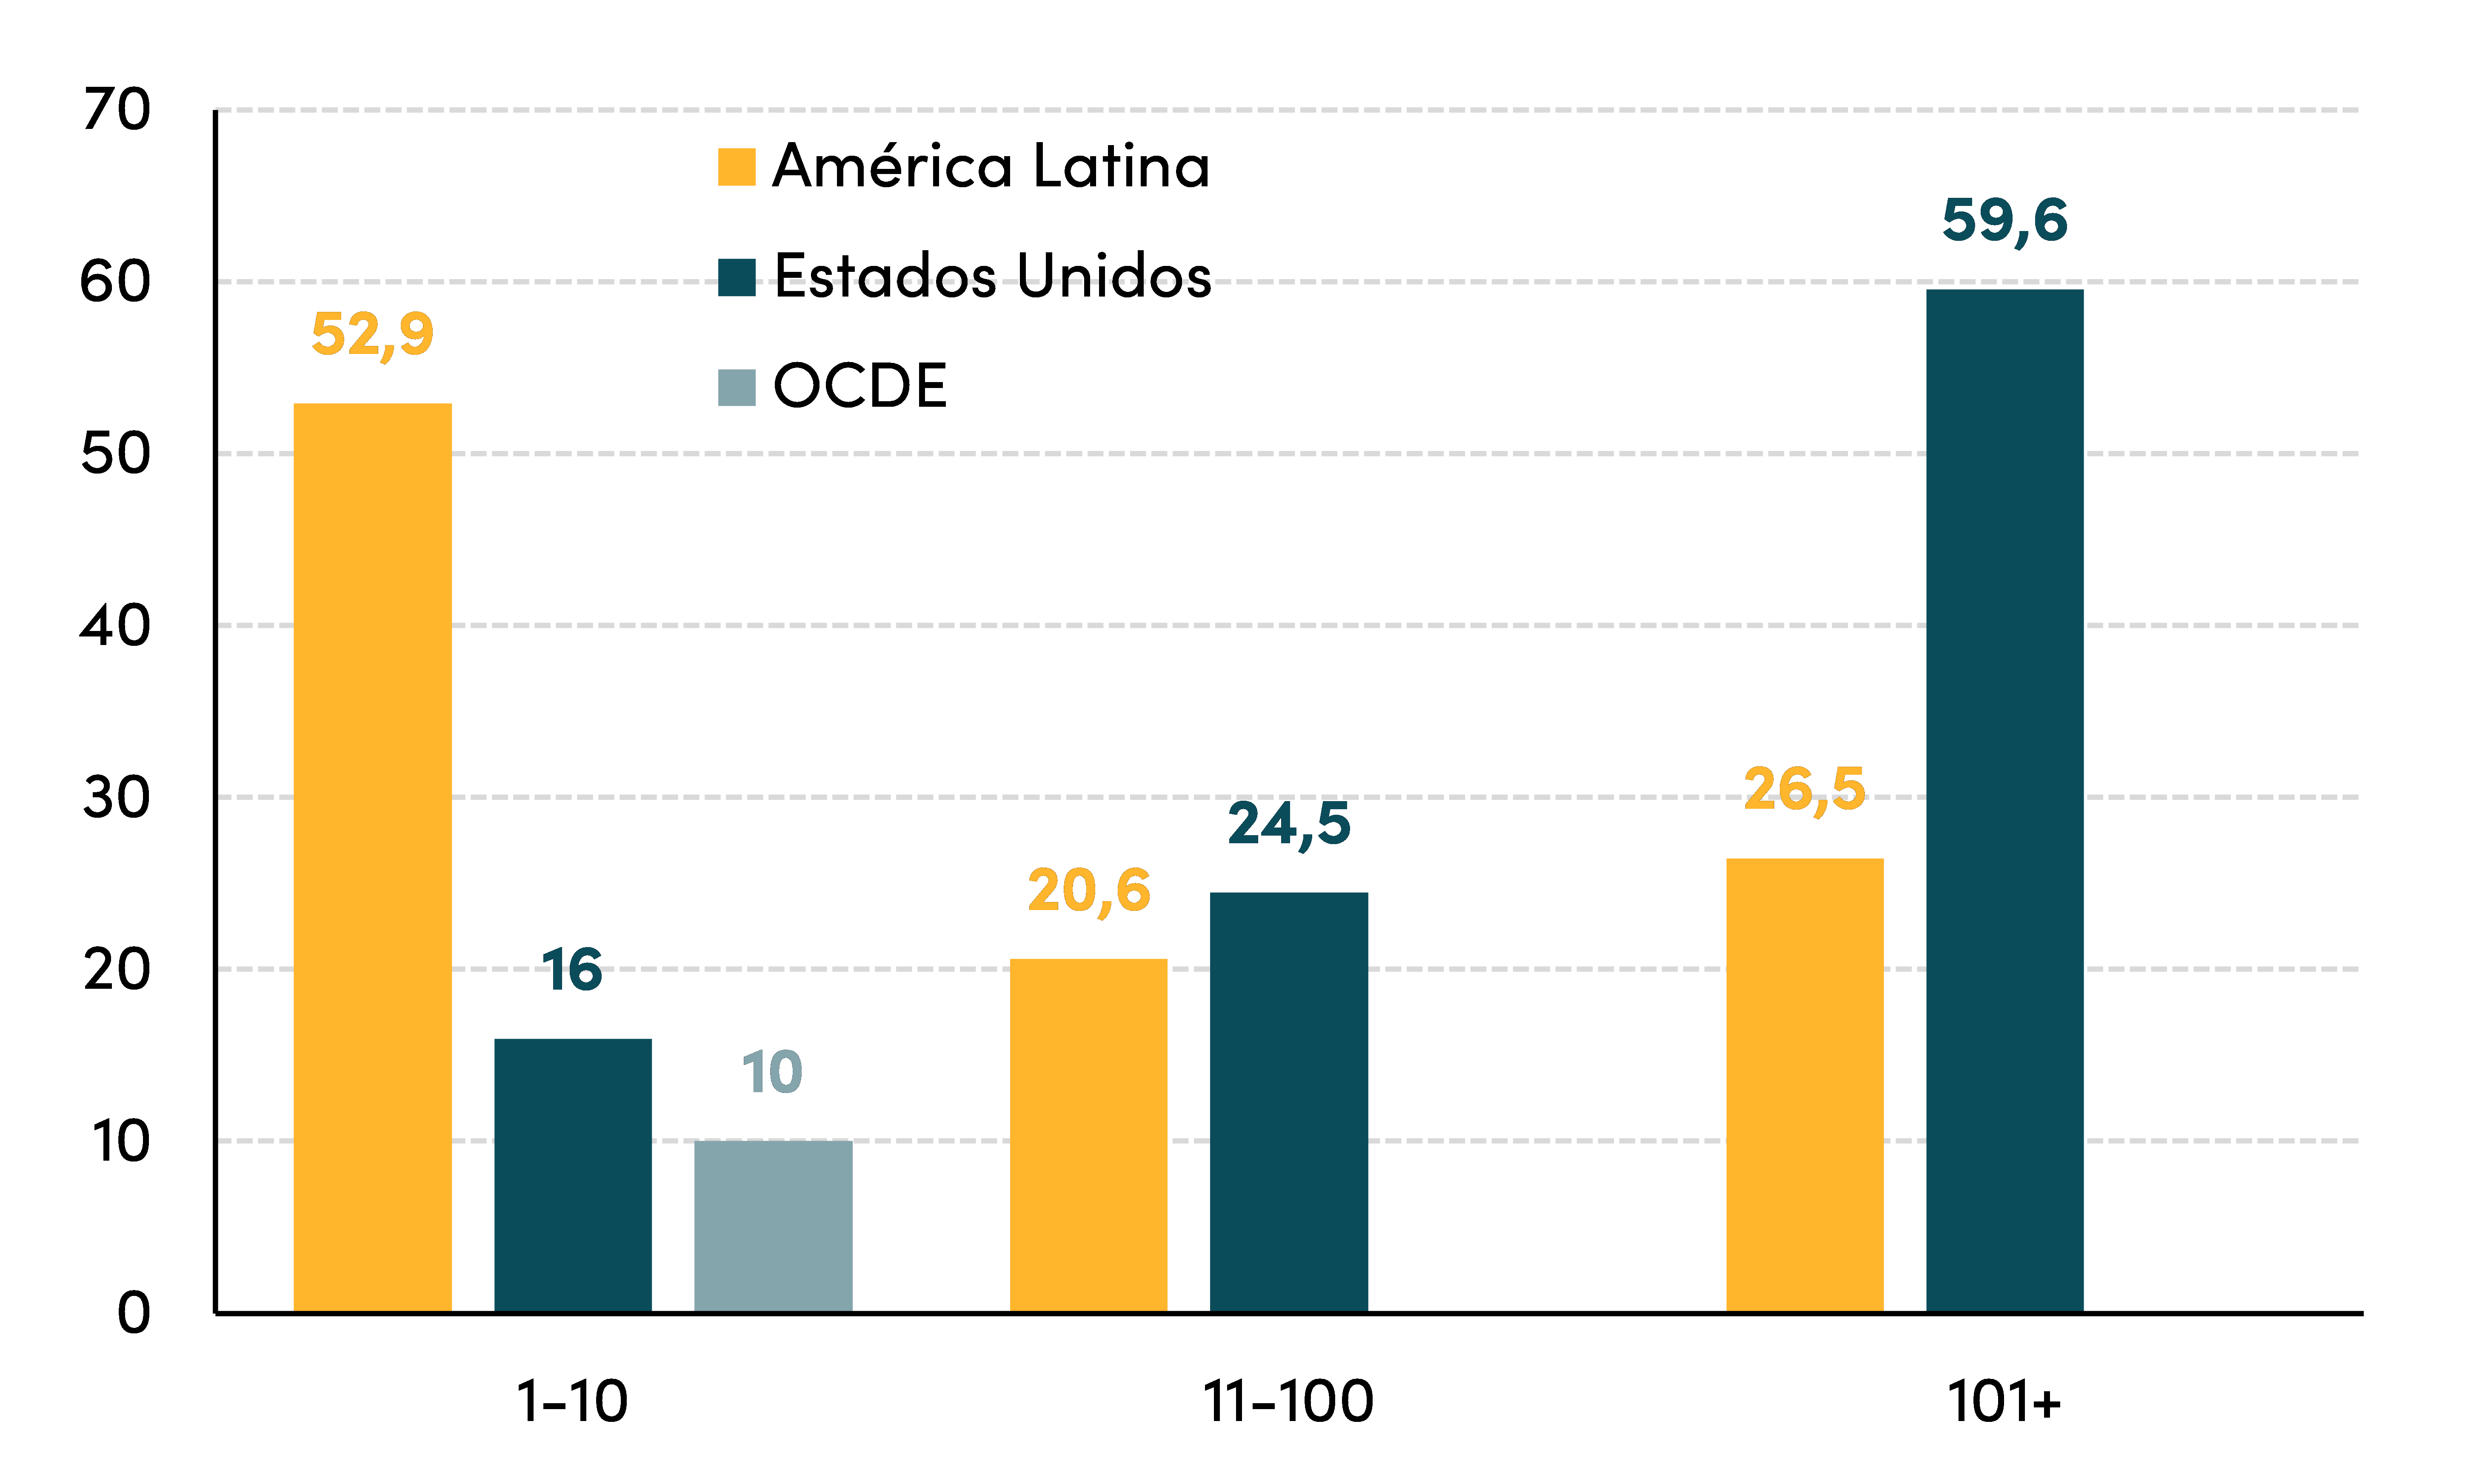
A well-known structural problem in Latin America is that firms[1] are generally quite small, and most workers in the region are concentrated in small firms. In recent years, about 32 percent of workers were self-employed, and of those working in firms, over 50 percent were in firms that employed 10 or fewer people (Figure 1). In contrast, most workers in OECD countries and the United States are employed by medium and large-size firms.
Firms’ size matters because smaller firms tend to be less productive (see OECD (2014) and Bento and Restuccia (2018)). The effect of firm size on productivity can be substantial,[2] and in Latin America, the productivity lag is a significant hindrance to growth.[3], [4]
Figure 1. Employment per firm size by number of workers (2017-2019; in percent)
Latin American workers are concentrated in smaller firms…
Source: Meléndez (2022) for Latin America and the United States and OECD (2022).
What is less well known is that the COVID-19 pandemic aggravated this problem by further shrinking the size of firms in Latin America.[5] This note presents evidence of this worrying outcome and complements research for a CGD-IDB working group report (Powell and Rojas-Suarez, forthcoming) that analyzes the different types of scarring suffered by firms and workers during the pandemic.
To evaluate the pandemic’s evolving impact on firm size, we delved into local databases, which was not an easy task since data is sparse, indicators are diverse and not always comparable, and information comes with a time lag (in some countries, a significant one). However, we identified three defining features that indicate firms became smaller as a result of the pandemic and widespread lockdowns:
- The net creation of firms shifted towards micro and small firms
- Across firm sizes, the average number of employees per firm decreased
- New firms are being created with less capital
The net creation of firms has shifted towards micro and small firms
Data for 2020, 2021, and 2022 shows that the distribution of firms has tilted towards smaller units: the net creation of firms (new firms minus closed firms)[6]resulted in an increase in the proportion of micro and/or small firms in several countries.
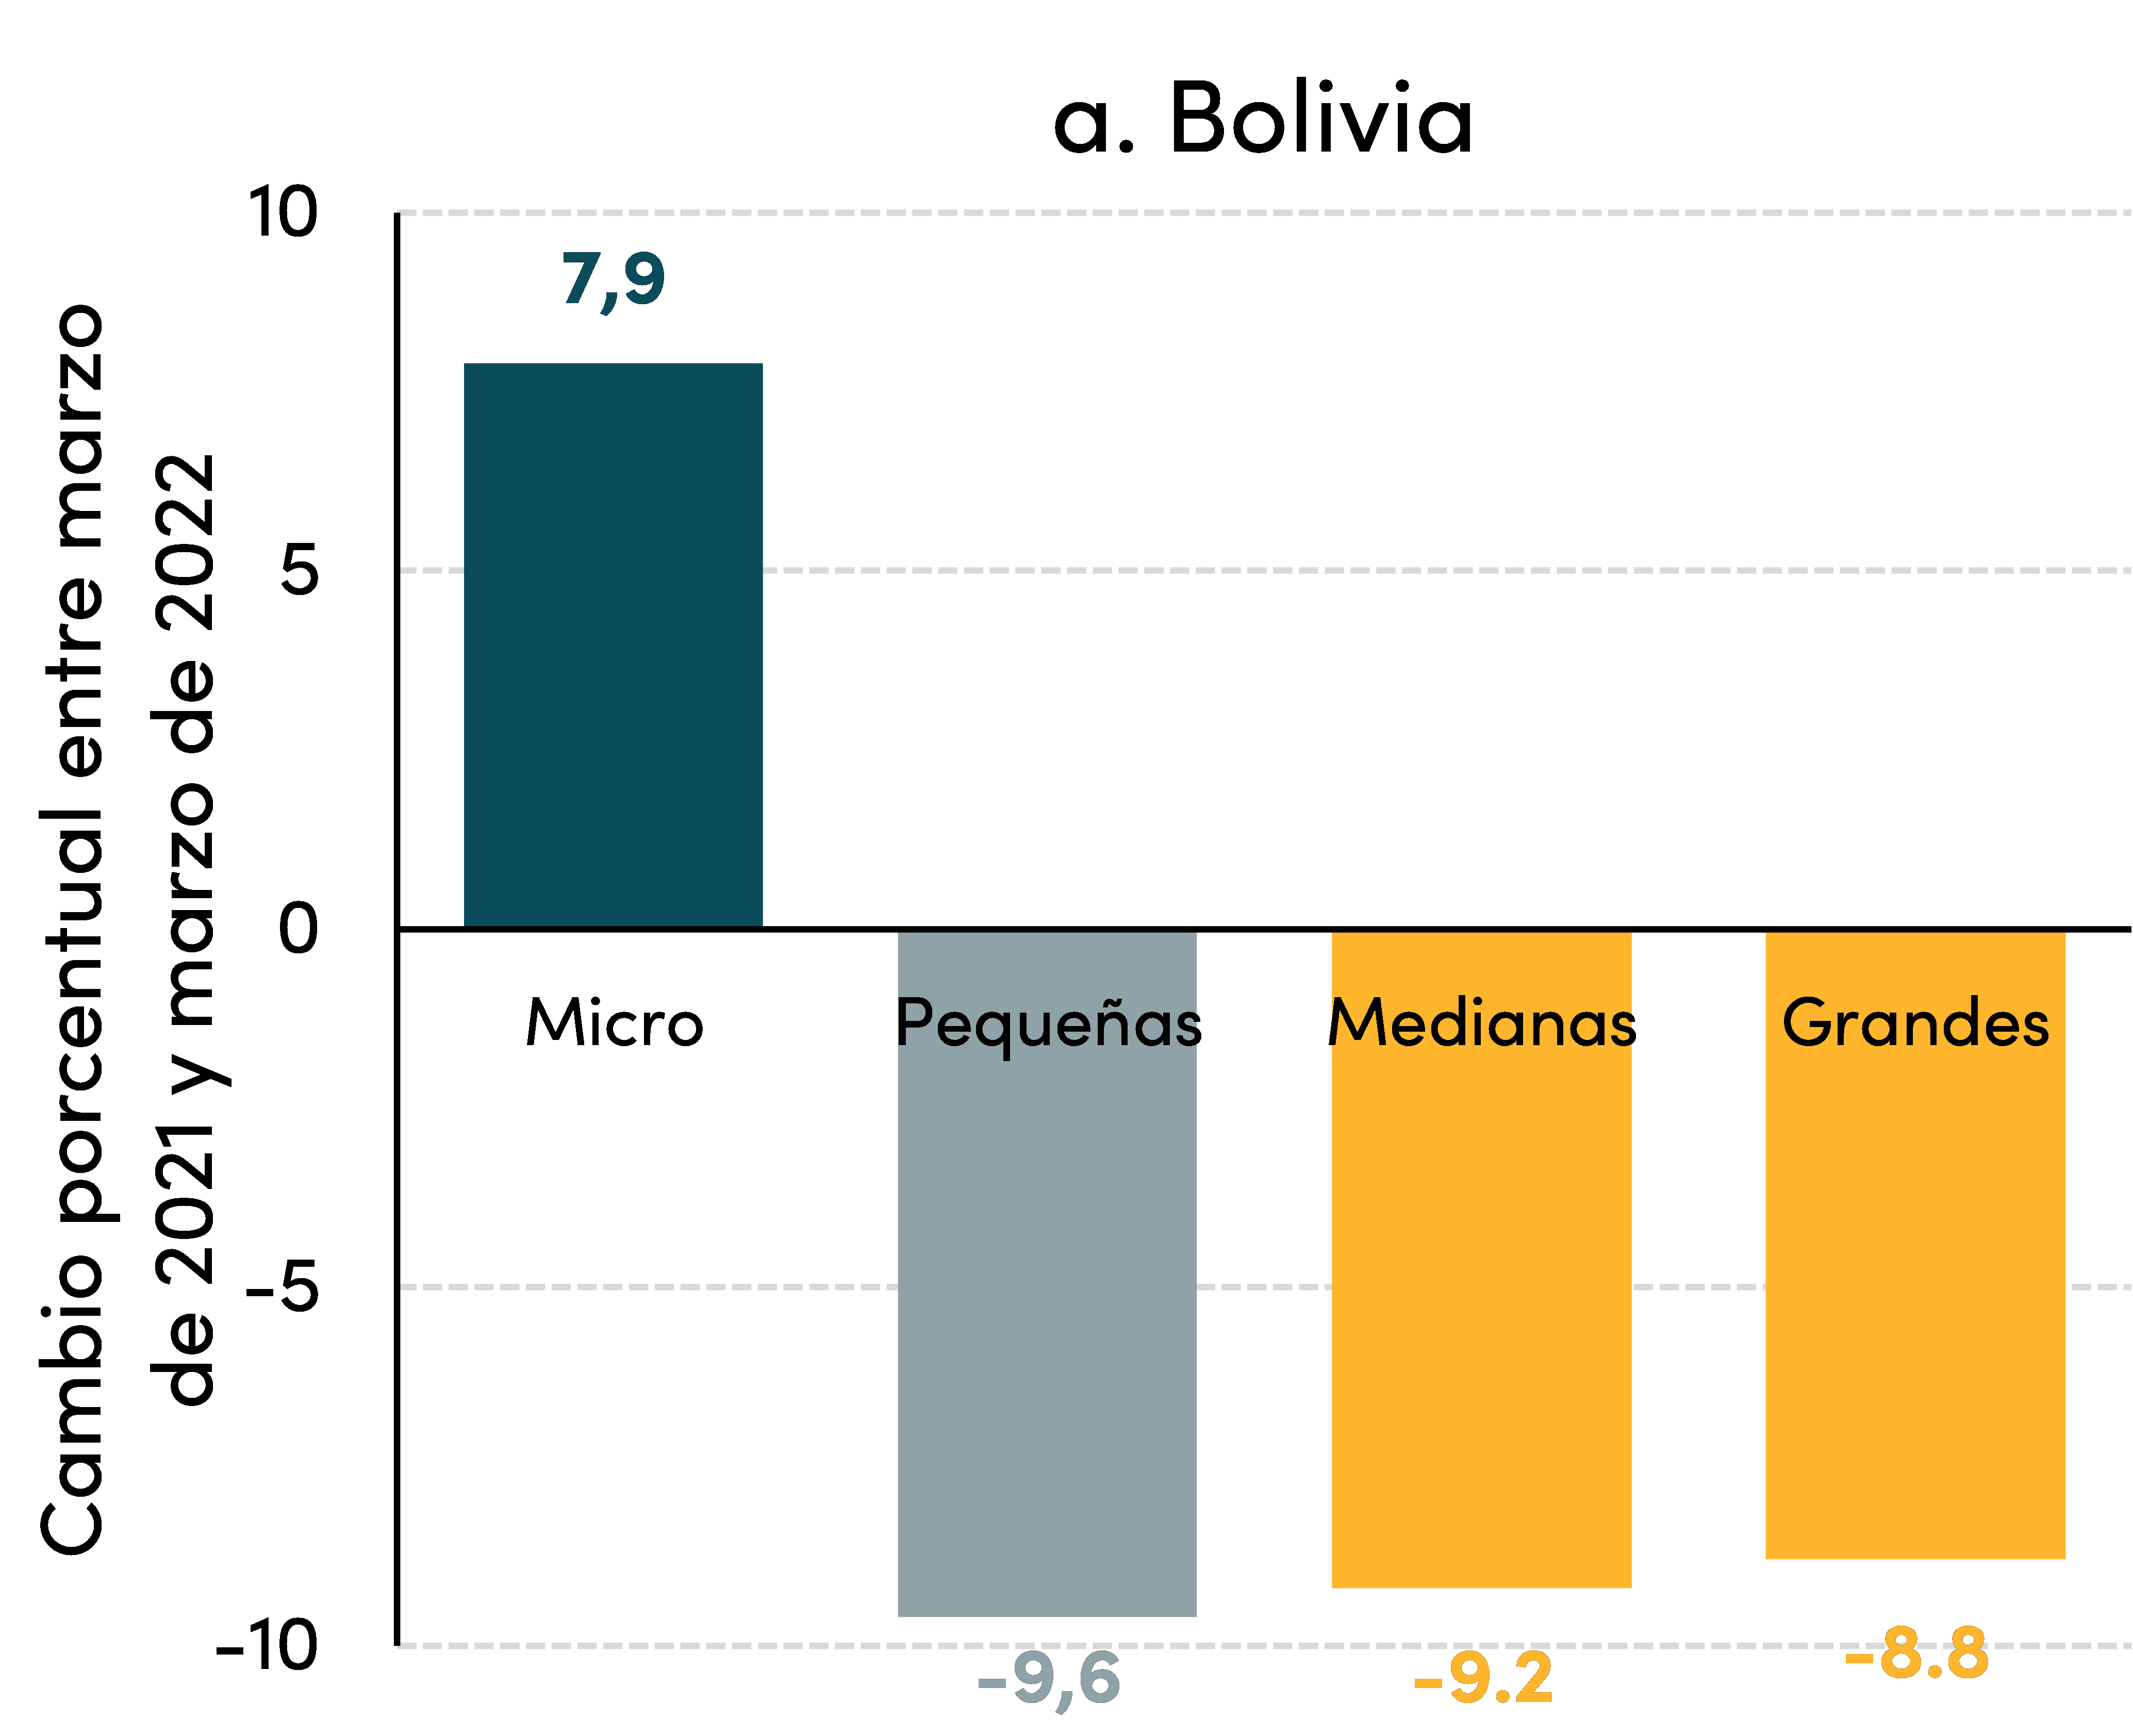
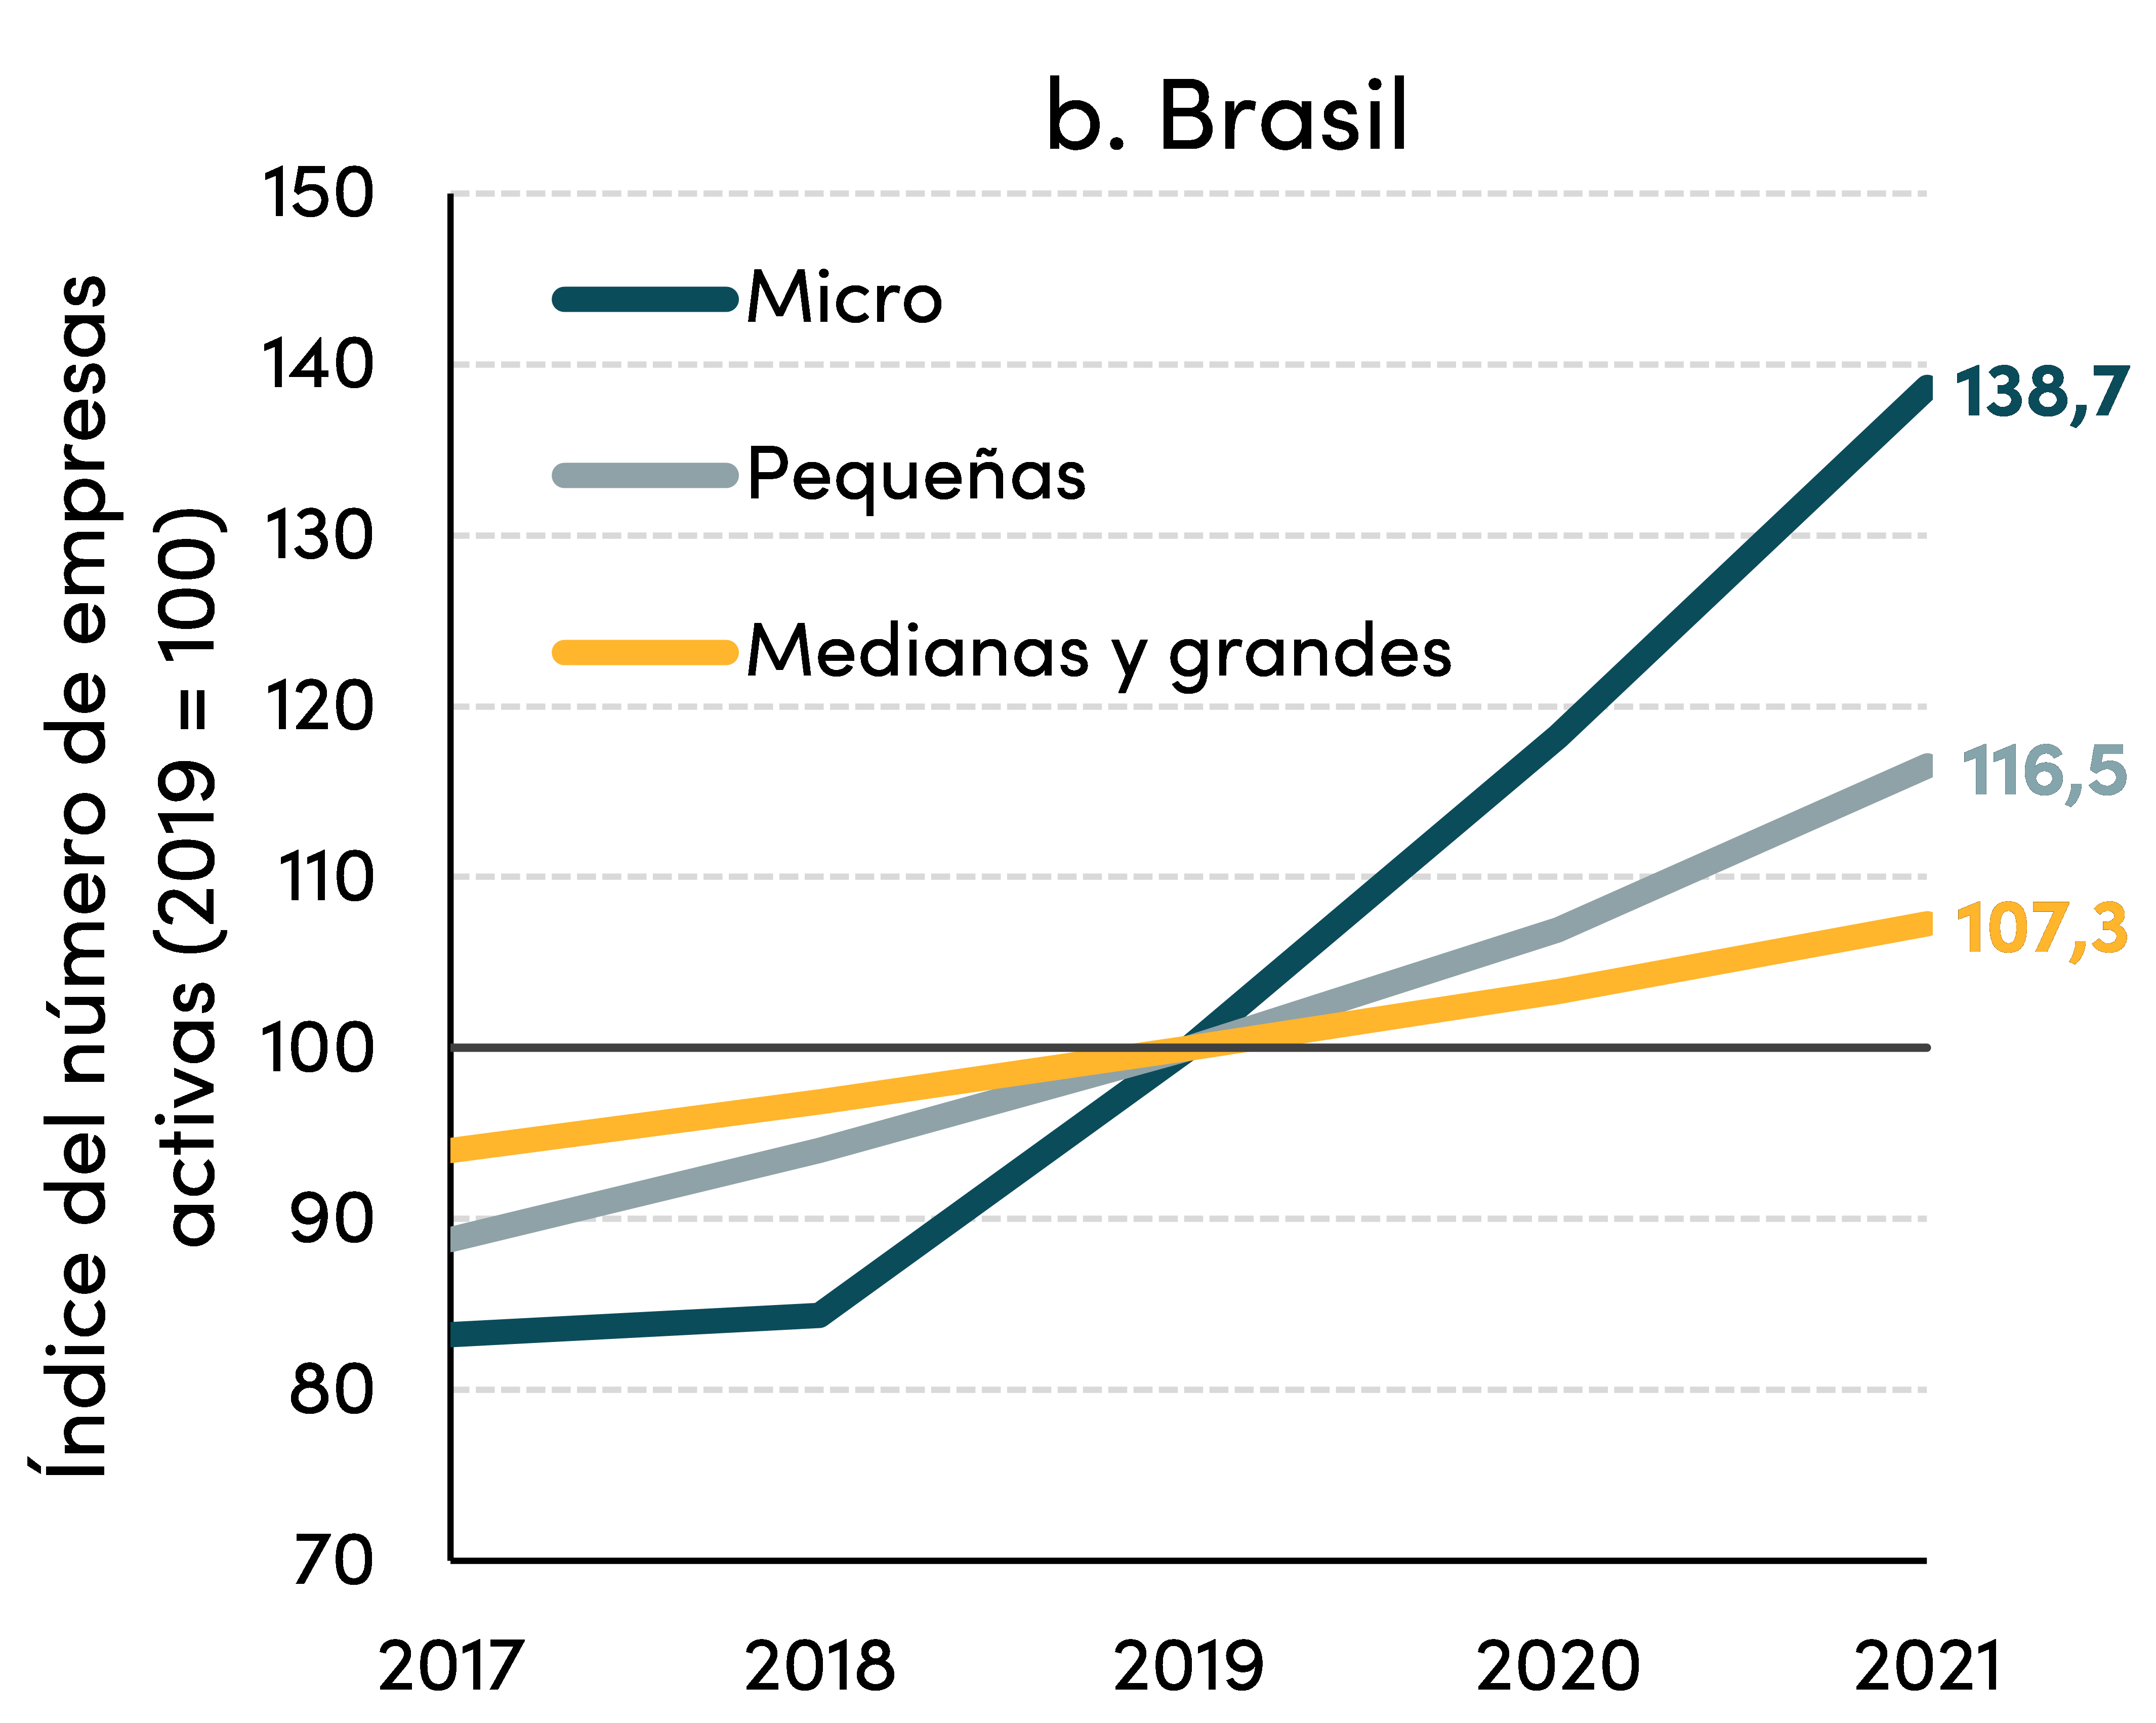
Data for Bolivia and Brazil illustrates this result. In Bolivia, between March 2021 (when data first became available) and March 2022 (latest data point), micro firms increased by 7.9 percent and now represent 87.1 percent of total firms (compared to 85.1 percent in 2021), while small, medium-size, and large firms all decreased substantially (Figure 2a). In Brazil, while there was strong firm creation throughout the pandemic—potentially due to the significant fiscal support from the government, which was the largest stimulus package in the region—it was mainly concentrated in micro firms (Figure 2b). These firms increased their proportion over the total and reinforced the regional trend. By March 2022, the number of micro firms had soared by 38.7 percent from pre-pandemic levels (2019), and small firms had also increased more than medium-size and large firms. Significantly, the move towards smaller firms has persisted beyond the peak of the pandemic and into 2022.
Figure 2. Net firm creation by firm size in Bolivia (March 2021-March 2022; percentage change) and Brazil (2017-2022; 2019=100)
Micro firms were the only firm type that grew (net of firm closing) in Bolivia, and micro and small firms outpaced medium-size and large firms in Brazil…
Source: Fundempresa (Bolivia) and Painel Mapa de Empresas (Brazil).
Less comprehensive but still revealing data exists for other countries and supports this trend. 2020 data (where more recent data was not available) and proxy measures (where net firm creation is not available) shows that this concerning pattern was common in the region.
2020 data
- In Chile, micro firms sustained strong growth during the peak of the pandemic in 2020, growing by 3.2 percent (considerably higher than its historical average of 2 percent), while small firms decreased by 0.5 percent and medium-size and large firms grew below their historical averages.
- In Dominican Republic, micro firms were the only group with positive growth net of closings between 2019 and 2020. The number of micro firms increased by 3.4 percent, while the number of small, medium-size, and large firms decreased (-13.3 percent, -17.5 percent, and -6.9 percent, respectively).
- In Ecuador only 3.1 percent of micro firms disappeared, while small, medium-size, and large firms closed at much higher rates (15.7 percent, 11.9 percent, and 12.5 percent, respectively).
- In Uruguay, between 2020 and 2019 small firms concentrated the net growth with an increase of 10 percent, while medium-size and large firms disappeared at high rates (14.3 percent and 10.8 percent, respectively).
Proxies
In Colombia and Peru, net firm creation data is not available. However, two alternative measures serve as proxies and show a similar pattern to the one observed in other countries.
- In Colombia, gross firm creation data (that is, not accounting for closings) shows that micro firms recovered pre-pandemic creation levels in 2021 and that small firms’ gross creation increased in both 2020 and 2021, while medium-size firms creation remained below 2019 levels.
- In Peru, sole proprietorship companies (a proxy for the smaller type of companies) outpaced the growth of the larger limited liability and public companies, suggesting that the shift towards smaller units also occurred there. Data for Bolivia paints a similar picture consistent with the data described above.
Of the nine countries for which data was available, Costa Rica is the only one in which firms’ net creation remained steady for all firm types between 2019 and 2021.
Across firm sizes, the average number of employees decreased
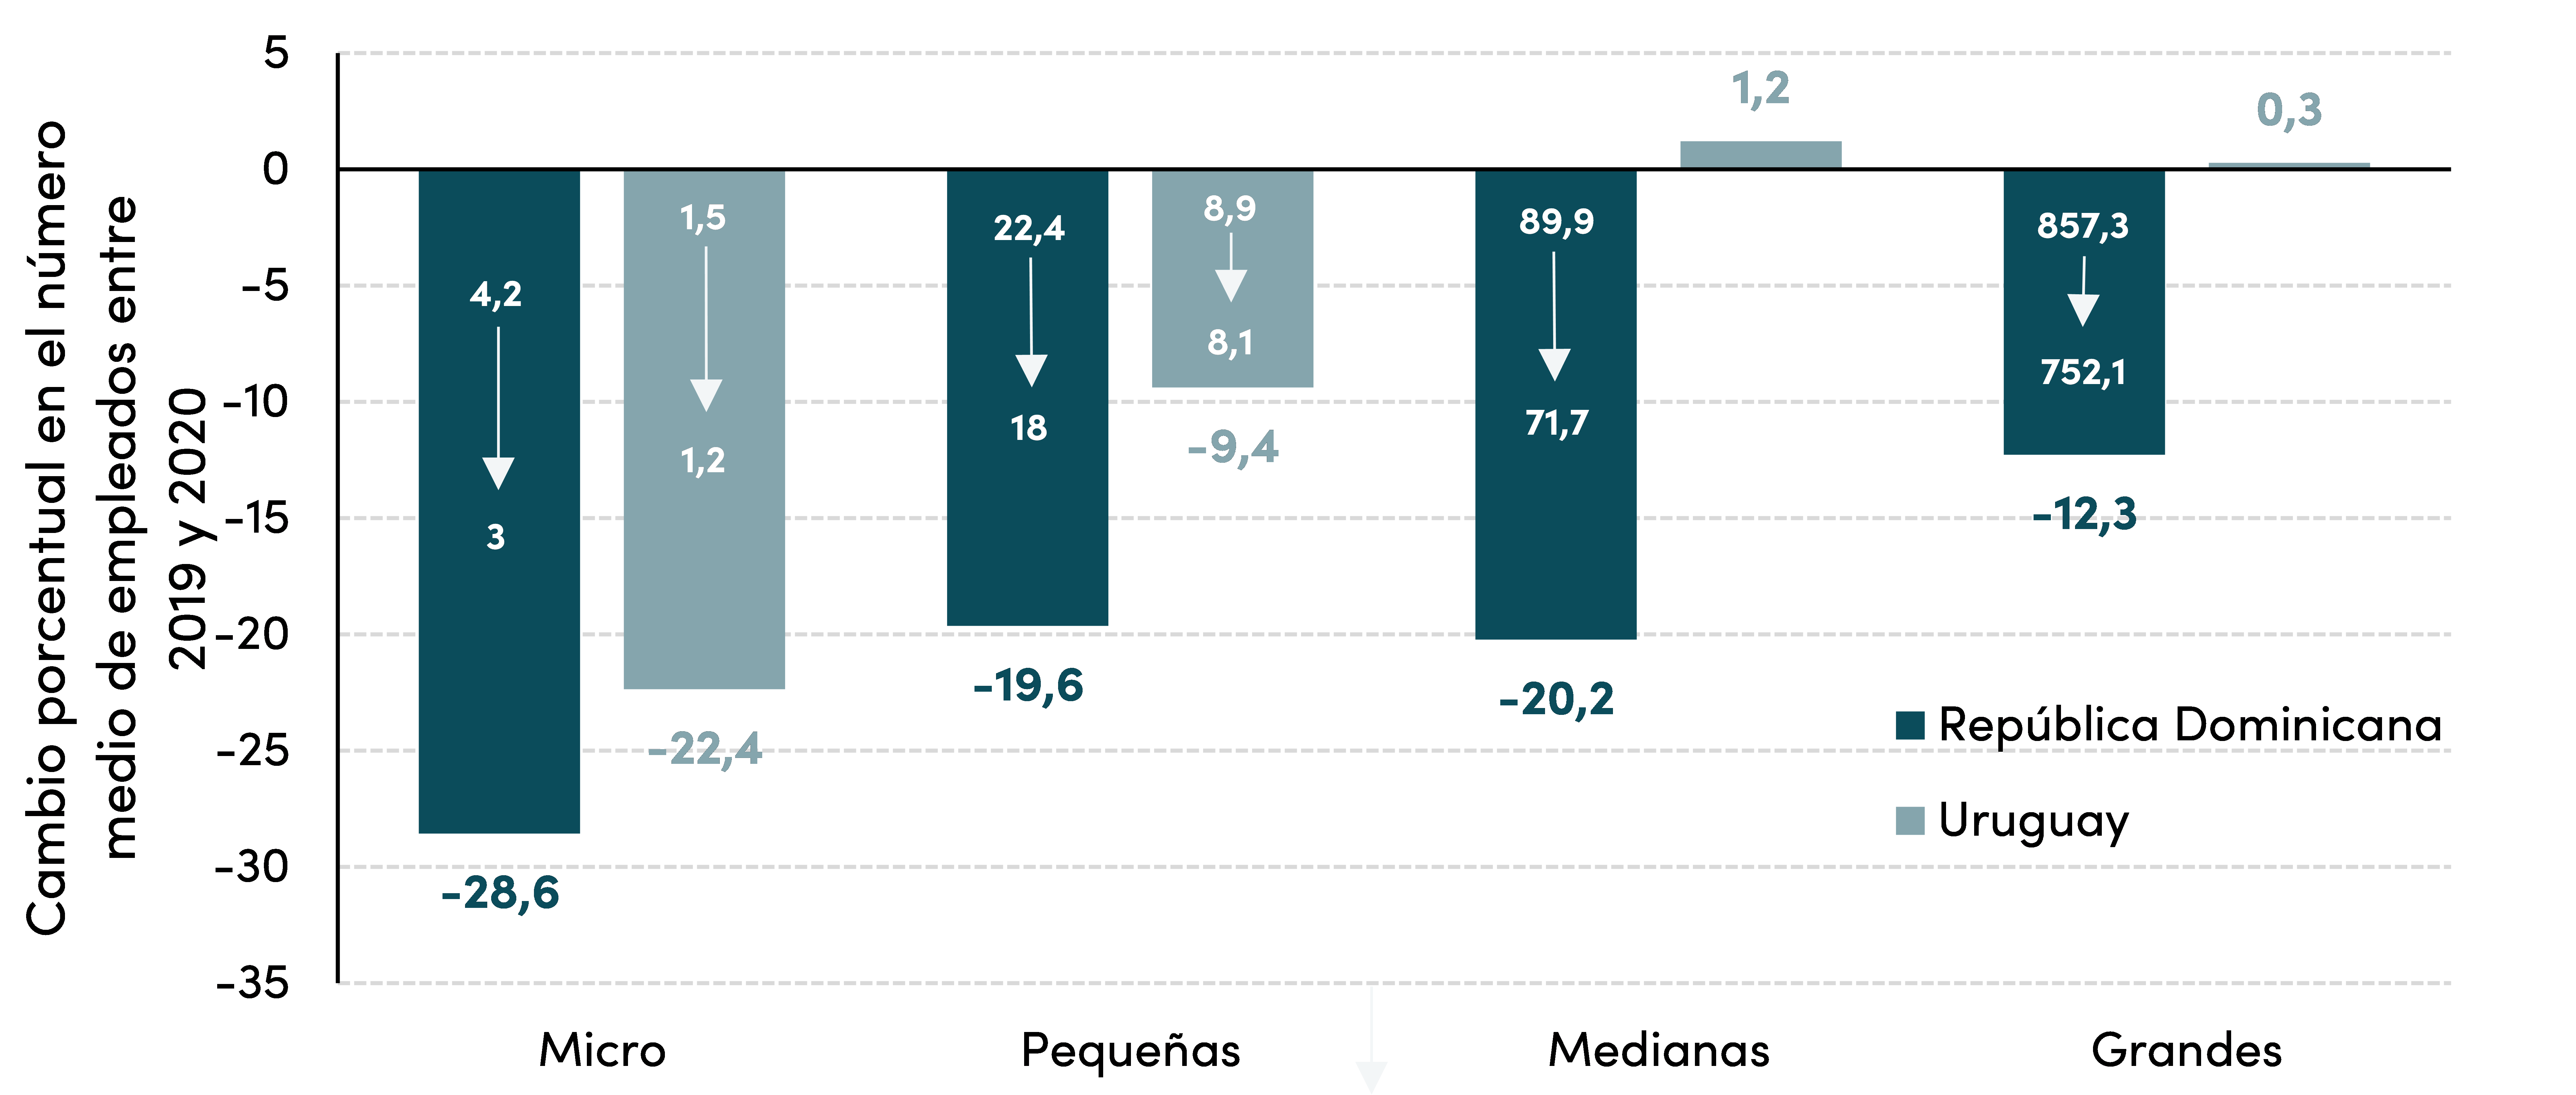
A pattern of reduction in average number of employees per firm was observed in Dominican Republic for all firm sizes and in Uruguay for micro and small firms. As shown in Figure 3, when classified by size, every firm type in Dominican Republic had a lower average number of employees in 2020 than in 2019. In Uruguay, while medium-size and large firms remained relatively unchanged in 2020, micro and small firms, which compose most of the firm universe, decreased sharply and the overall average number of employees per firm decreased by 15 percent.
Figure 3. Average number of employees per firm in Dominican Republic and Uruguay, by firm size (2019-2020; percentage change)
Average number of employees per firm decreased across the board in Dominican Republic and in micro and small firms in Uruguay…
Source: Oficina Nacional de Estadística Directorio de Empresas y Establecimientos (Dominican Republic, see 2019 and 2020) and Instituto Nacional de Estadística (Uruguay).
Note: The upper numbers inside the bars indicate the 2019 average number of employees and the lower ones the respective values for 2020.
Surveys in Mexico indicate that the average number of employees in small and medium-size enterprises (SMEs) also fell; importantly, the data from Mexico includes informal firms. As shown in Figure 4, the average number of employees working in SMEs was 13.3 percent smaller in 2021 than in 2019.
Figure 4. Average number of employees in SMEs in Mexico (2019 and 2021)
SMEs' average number of employees dropped…
Source: INEGI.
Note: 2019 data is for May and 2021 data is for July.
Survey data from other countries is consistent with this evidence. In Colombia, a study of micro firms indicates that, among the smaller type of firms, the average number of employees decreased by 5 percent in 2020 and remained about the same level in 2021, suggesting some persistence. In Paraguay, an SME survey comparing 2019 and 2020 shows that 41.8 percent of micro, 53.2 percent of small, and 59.2 percent of medium-size firms reduced their number of employees and that very few firms expected to increase employment in coming years. Ecuador is the only exception, among countries for which we could find data, as the number of employees increased across the board. Yet, as discussed in the previous section, the firm type distribution in Ecuador moved towards micro firms.
New firms are being created with less capital
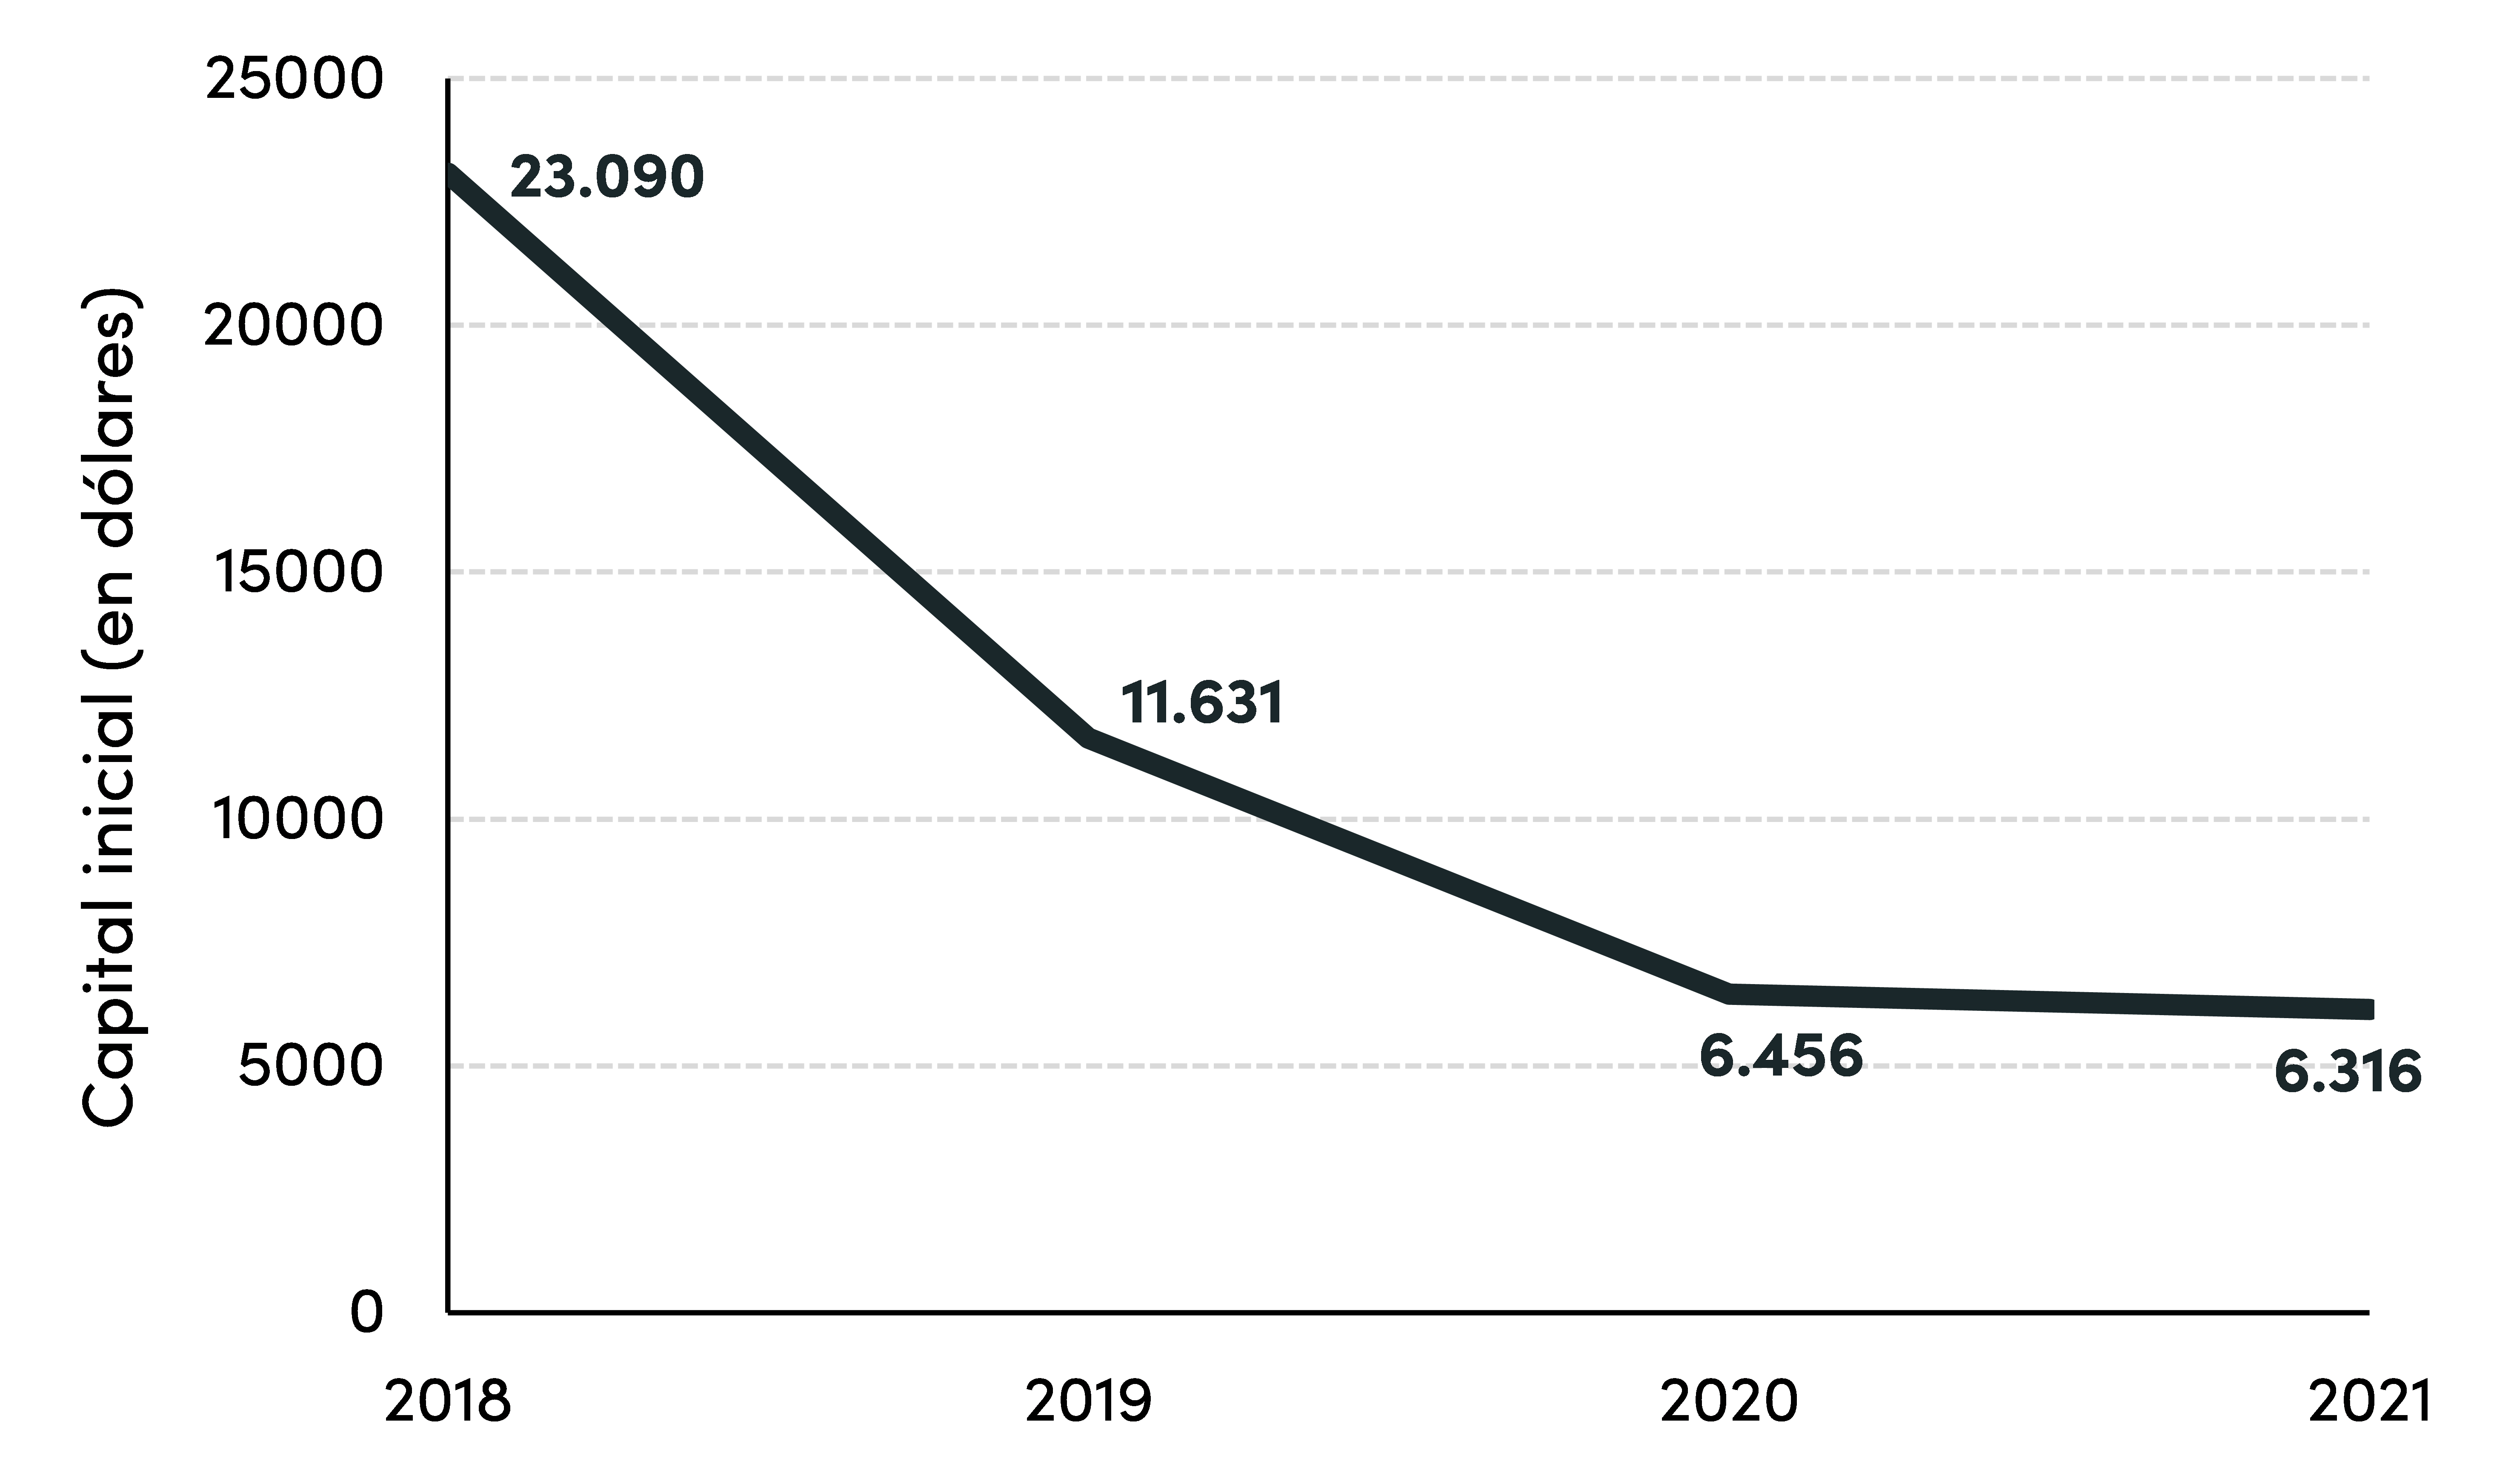
Data from Chile shows that in 2020 and 2021, new firms were created with substantially less capital than in pre-pandemic years (Figure 5). Firms’ average capital fell by 44.4 percent in 2020 compared to 2019, and decreased further, by 2.7 percent, in 2021 (and even more when compared to the average for 2013-2019). Although 2022 data (up to April) suggests a partial recovery, at an average capital of US$9,500, new firms were still being created with just 82 percent of the capital invested in 2019.
Figure 5. Average capital of new firms per year in Chile in thousands of US dollars (2018-2021)
New firms’ average capital decreased considerably…
Source: Registro de empresas y sociedades.
The data from Chile is consistent with the findings of the upcoming CGD-IDB report, which shows that investment in the region decreased broadly across sectors for large firms.
Summing up
Investment and firm size—both in terms of the distribution of micro, small, medium-size, and large firms and of the average number of employees—are key structural indicators of the strength and dynamism of the national economy that policymakers need to monitor and consider when designing emergency and recovery policies. The pandemic-induced reduction in firms’ size, from an already very small base, reinforces the region’s productivity trap and adds new obstacles to future growth. While these outcomes are to some extent natural, and smaller firms are crucial engines of employment and economic activity, if these firms are not able to grow and invest, the region's fragilities will only increase. The forthcoming CGD-IDB report offers recommendations for addressing these enormous challenges. A recovery that rests upon the shoulders of even smaller firms makes Latin America a giant with feet of clay.
[1]Throughout this note, “firms” refers to formal firms, unless otherwise noted.
[2] Leung, Meh, and Terajima (2008) find that 50 percent of the labor productivity gap in manufacturing between the US and Canada can be explained by firm size.
[3] These are not minor issues; experiences in Chile (Garone et al., 2020) further show that there are considerable differences in productivity within industries and that these differences are highly persistent.
[4] A misallocation of resources often explains the smaller firm size and some estimates indicate that an adequate reallocation of capital and labor would increase total factor productivity between 45 and 127 percent in the region. Studies for Mexico and Latin America also link misallocation to the prevalence of informality.
[5] As of March 2022 (two years after the onset of the pandemic) formal employment had not fully recovered to pre-pandemic levels in many countries, and informality had increased. Evidence shows that policy responses have been largely ineffective in helping smaller firms.
En América Latina existe un problema estructural asociado con el tamaño de las empresas[1]; una gran parte de estas son pequeñas y emplean a la mayoría de los trabajadores de la región. En los últimos años, cerca del 32% de los trabajadores figuran como autónomos y, de los trabajadores por cuenta ajena, más del 50% trabaja en empresas pequeñas de menos de 10 empleados (Figura 1). Por el contrario, en los países de la OCDE y en Estados Unidos, la mayoría de los trabajadores forman parte de medianas o grandes empresas.
Este es un problema conocido y de gran relevancia porque las empresas pequeñas tienden a ser menos productivas (véase OECD (2014) y Bento y Restuccia (2018)). El tamaño de las empresas puede tener un efecto significativo la productividad][2], y en América Latina el bajo nivel de productividad es un lastre significativo para el crecimiento.[3] ][4]
Figura 1. Empleo por tamaño de empresa según el número de trabajadores (2017-2019; en porcentaje)
En América Latina los trabajadores se concentran en empresas más pequeñas...
Fuente: Meléndez (2022) para América Latina y Estados Unidos y OECD (2022).
Algo que es menos conocido es que la pandemia de la COVID-19 ha intensificado este problema al reducir aún más el tamaño de las empresas. En este documento se muestran indicadores de esta preocupante tendencia. Además, esta nota complementa un informe elaborado por el grupo de trabajo del CGD y el BID (Powell y Rojas-Suarez, por publicar), en el que se analizan las cicatrices que ha dejado la pandemia en empresas y trabajadores.[5]
Para evaluar el impacto de la pandemia en el tamaño de las empresas, se han examinado bases de datos nacionales, lo cual ha sido un proceso difícil, pues los datos son escasos, los indicadores son diversos y no siempre comparables y la información llega con un desfase temporal significativo en algunos países. Sin embargo, hemos identificado tres aspectos clave que muestran que el tamaño de las empresas ha disminuido debido a la pandemia y a las medidas generalizadas de confinamiento:
- La creación neta de micro y pequeñas empresas ha sido mucho mayor a de las medianas y grandes empresas;
- el número medio de empleados ha disminuido en el conjunto de empresas, independientemente de su tamaño; y
- las nuevas empresas se crean con menos capital.
La creación neta de micro y pequeñas empresas ha sido mucho mayor a la de las medianas y grandes
Los datos de 2020, 2021 y 2022 indican que la distribución de las empresas se ha movido hacia las unidades más pequeñas: las dinámicas de creación neta de empresas (total de nuevas empresas menos el total de empresas cerradas) [6] ha llevado a un aumento en la proporción de microempresas y/o pequeñas empresas en varios países.
Los datos de Bolivia y Brasil ilustran este resultado. En Bolivia, entre marzo de 2021 (cuando se publicaron los datos por primera vez) y marzo de 2022 (últimos datos), el número de microempresas aumentó un 7,9% y ya representan el 87,1% del total de empresas (que compara con el 85,1% en 2021), mientras que las pequeñas, medianas y grandes empresas presentan una caída significativa (Figura 2a). En Brasil, si bien se registró una fuerte creación de empresas durante la pandemia (posiblemente debido al considerable apoyo fiscal del gobierno, que implementó el mayor paquete de estímulo de la región), ésta se concentró principalmente en las microempresas (Figura 2b), que aumentaron su peso sobre el total y reforzaron la tendencia regional. A marzo de 2022, el número de microempresas había disparó (+38,7%) con respecto a los niveles anteriores a la pandemia (2019), y el número de pequeñas empresas ha aumentado más que el de medianas y grandes empresas. Cabe destacar que esta dinámica de creación neta de empresas más pequeñas se ha mantenido más allá del pico de la pandemia y a lo largo de 2022.
Figura 2. Creación neta de empresas en Bolivia por tamaño de empresa (marzo 2021-marzo 2022; variación porcentual) y en Brasil (2017-2022; empresas activas 2019=100)
De todos los tipos de empresa, las microempresas son las únicas que aumentaron en número (neto de cierres) en Bolivia y las micro y pequeñas empresas superaron a las medianas y grandes en Brasi
Fuente: Fundempresa (Bolivia) y Painel Mapa de Empresas (Brasil).
Para otros países, existen datos menos exhaustivos, pero igualmente concluyentes, que corroboran esta tendencia. Los datos de 2020 (cuando no se disponía de estadísticas más recientes) y medidas alternativas (cuando no se disponía de los datos de creación neta de empresas) muestran que este patrón tan alarmante ha sido común en toda la región.
Datos de 2020
- En Chile, las microempresas continuaron creciendo con solidez durante el pico de la pandemia en 2020, aumentando su número en un 3,2% (considerablemente superior a su media histórica de 2%), mientras que el número de pequeñas empresas bajó un 0,5% y las medianas y grandes empresas crecieron por debajo de su promedio histórico.
- En República Dominicana, las microempresas fueron el único grupo que registró un crecimiento neto positivo entre 2019 y 2020. El número de microempresas se incrementó un 3,4%, mientras que el de pequeñas, medianas y grandes empresas disminuyó (-13,3%, -17,5% y -6,9%, respectivamente).
- En Ecuador sólo cerró el 3,1% de las microempresas, mientras que el porcentaje de cierre de pequeñas, medianas y grandes empresas fue mucho más elevado (15,7%, 11,9% y 12,5%, respectivamente).
- En Uruguay, entre 2020 y 2019, el crecimiento neto se concentró en el grupo de pequeñas empresas, con un incremento del 1%, mientras que el porcentaje de medianas y grandes empresas que desaparecieron fue muy elevado (14,3% y 10,8%, respectivamente).
Variables alternativas
En Colombia y Perú no hay datos disponibles sobre la creación neta de empresas. Sin embargo, hay dos variables alternativas que muestran un patrón similar al observado en otros países.
- En Colombia, la cifra de creación bruta de empresas—es decir, sin considerar los cierres—muestra que las microempresas recuperaron los niveles de creación anual anteriores a la pandemia en 2021 y que la creación bruta de pequeñas empresas aumentó tanto en 2020 como en 2021, mientras que la creación de empresas medianas se mantuvo por debajo de los niveles de 2019.
- En Perú, las empresas unipersonales (que pueden servir como una aproximación a la dinámica de las empresas más pequeñas) superaron el crecimiento de las empresas de responsabilidad limitada y públicas (que suelen ser más grandes). Los datos de Bolivia reflejan una tendencia similar, en línea con los datos descritos anteriormente.
De los nueve países con datos disponibles, Costa Rica es el único en el que la creación neta de empresas se mantuvo estable para todos los tipos de empresas entre 2019 y 2021.
El número medio de empleados ha disminuido en el conjunto de empresas, independientemente de su tamaño
Tanto en República Dominicana, en todos los tipos de empresa clasificados por tamaño, como en Uruguay, en micro y pequeñas empresas se puede observar una reducción del número medio de empleados por empresa. Como se muestra en la Figura 3, todas las categorías en República Dominicana registran un número medio de empleados menor en 2020 que en 2019 (los números en la parte superior del interior de las barras indican el número medio de empleados de 2019 y los de la parte inferior los valores correspondientes para 2020). En Uruguay, si bien las medianas y grandes empresas no presentan variaciones significativas en 2020, las micro y pequeñas empresas, que componen la mayor parte del universo empresarial, registran una fuerte reducción, lo que produjo una caída del 15% en el promedio general de empleados por empresa.
Figura 3. Media de empleados por empresa en República Dominicana y Uruguay, por tamaño de empresa (2019-2020; variación porcentual)
El número medio de empleados por empresa cayó de forma generalizada en República Dominicana y en las micro y pequeñas empresas en Uruguay...
Fuente: Oficina Nacional de Estadística Directorio de Empresas y Establecimientos (Repçublica Dominicana, ver 2019 y 2020) y el Instituto Nacional de Estadística (Uruguay).
Las estadísticas en México indican que el número medio de empleados en pequeñas y medianas empresas (pymes) también se contrajo; aunque cabe destacar que los datos de México incluyen empresas informales. Como se observa en la Figura 4, el promedio de empleados en las pymes cayó un 13,3% entre 2021 y 2019.
Figura 4. Número medio de empleados de las pymes en México (2019 y 2021)
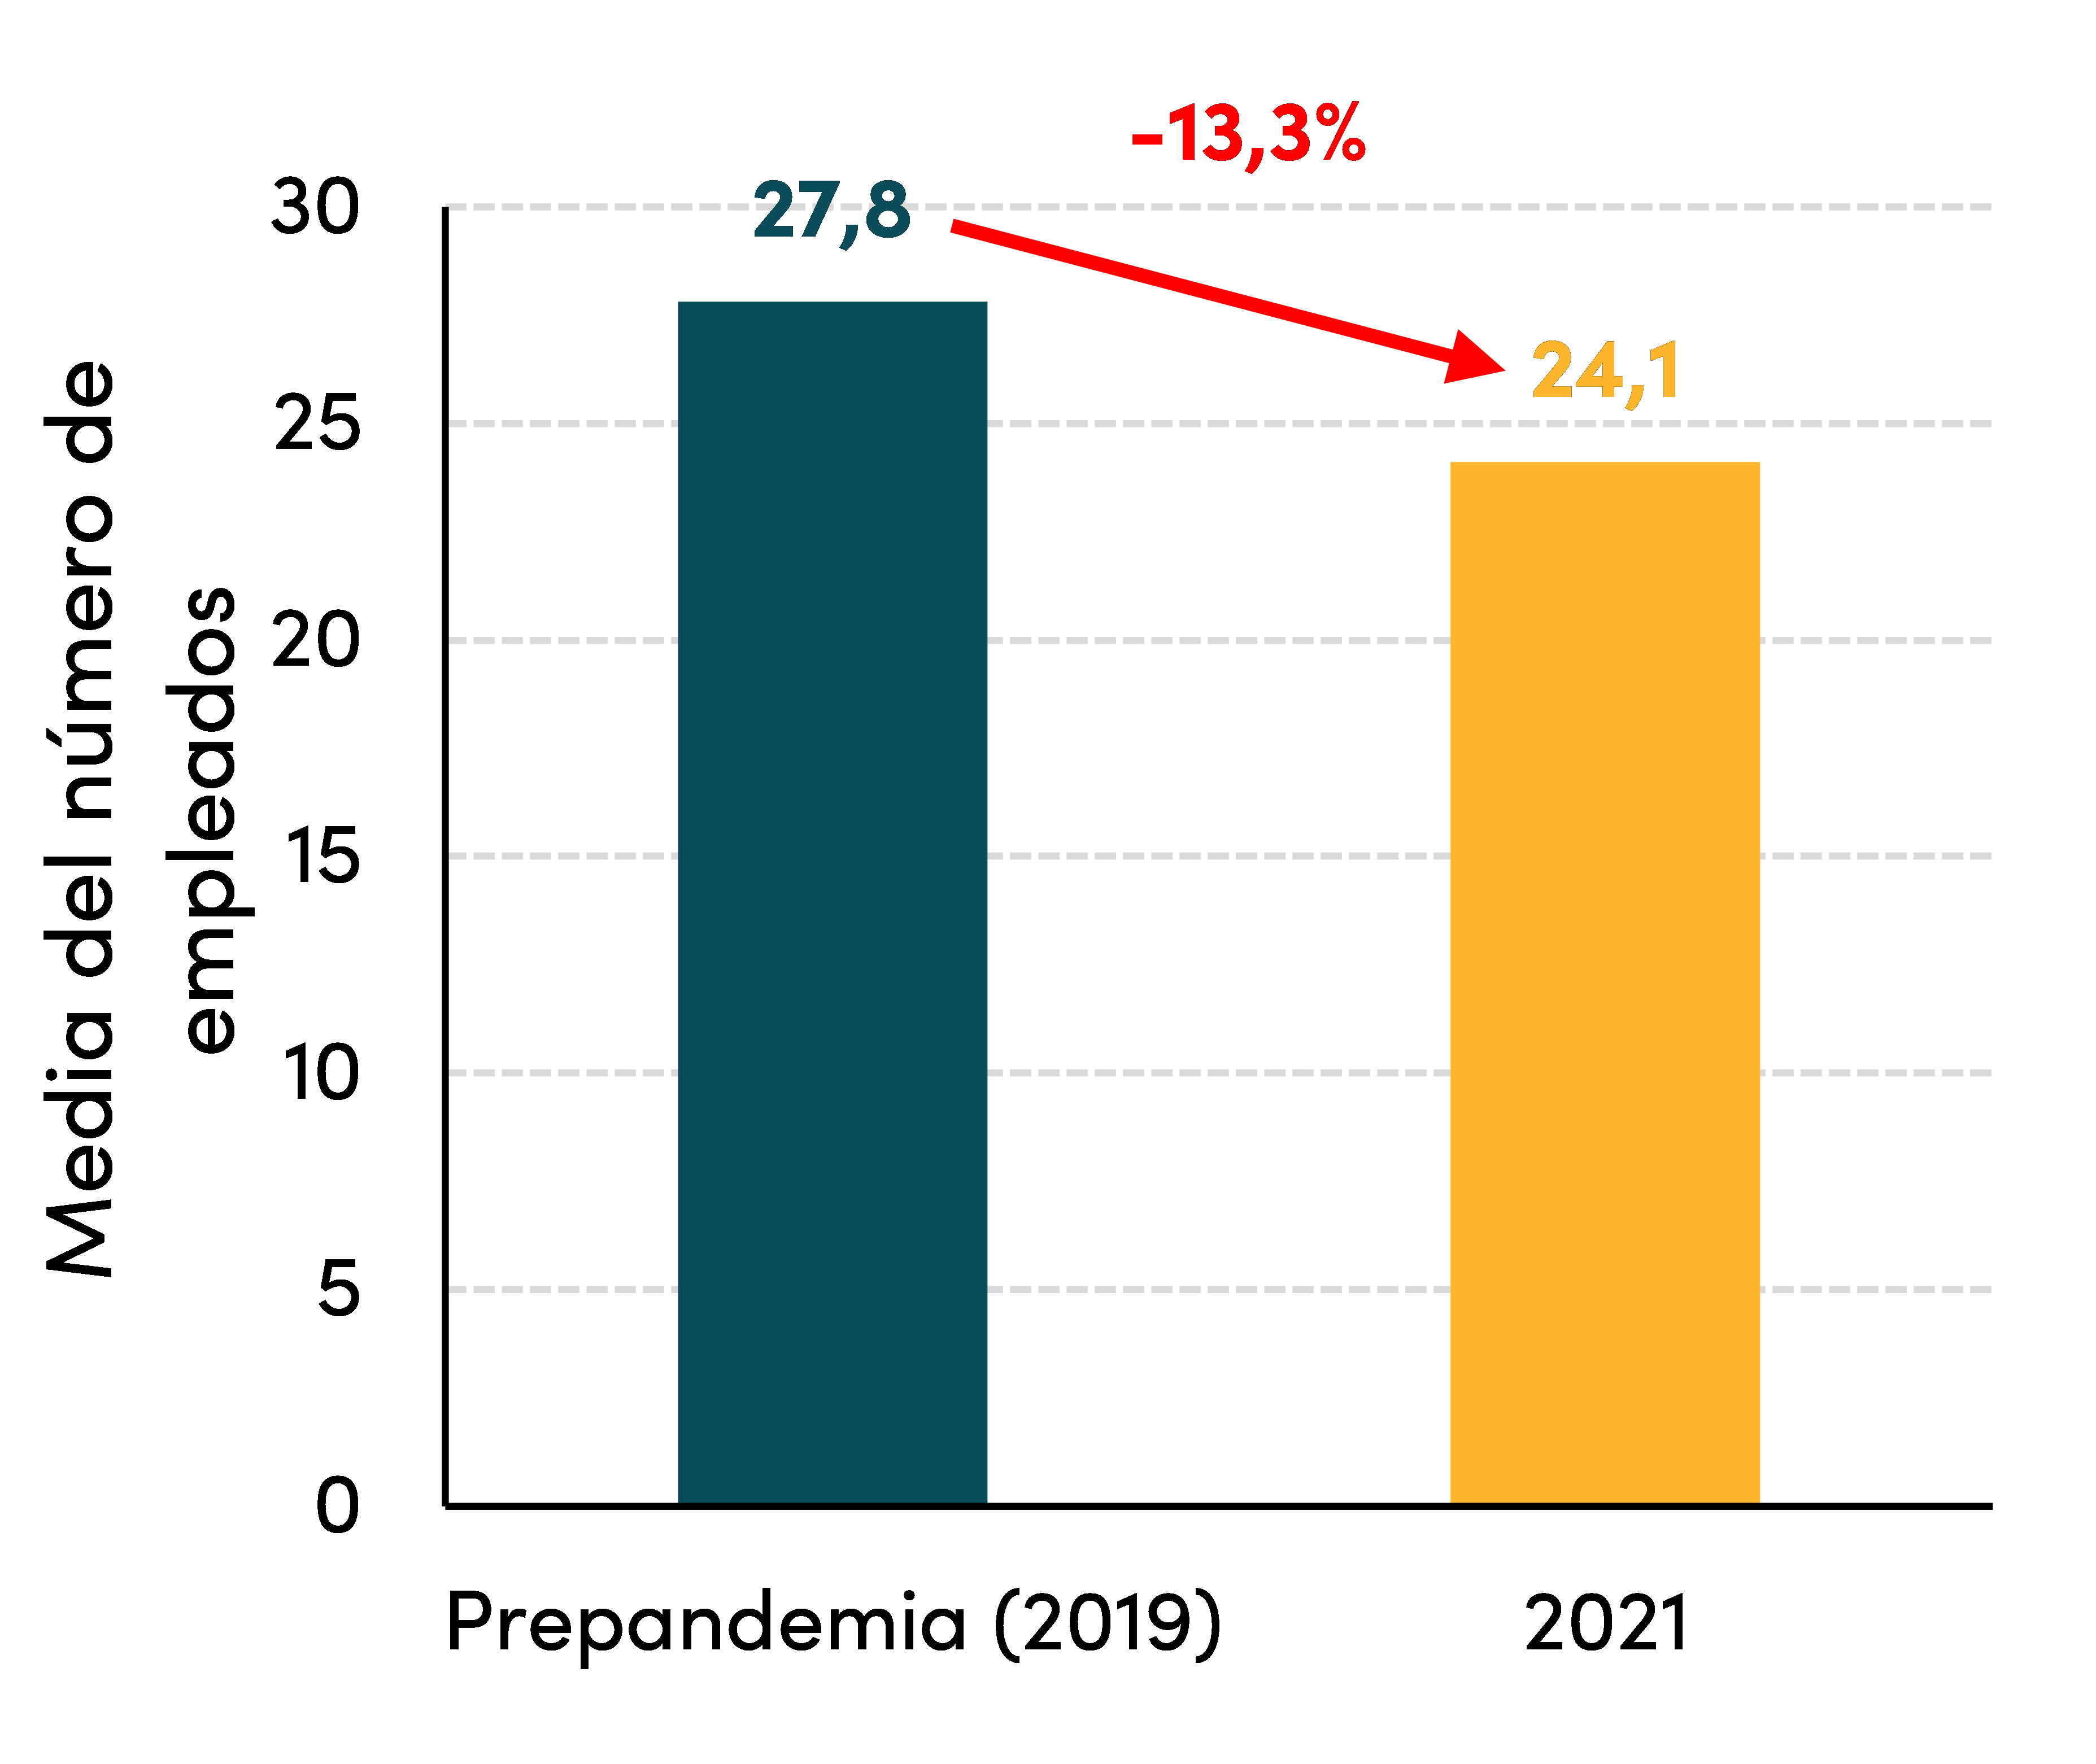
El número medio de empleados por pyme ha caído…
Fuente: INEGI. Nota: Los datos de 2019 corresponden al mes de mayo y los datos de 2021 a julio.
Datos de encuestas en otros países están en línea con estos resultados. En Colombia, un estudio sobre las microempresas muestra que, entre el tipo de empresas más pequeñas, el número medio de empleados se redujo un 5% en 2020 y se mantuvo al mismo nivel en 2021, lo que sugiere cierta persistencia. En Paraguay, una encuesta realizada a pymes que compara los años 2019 y 2020 mostró que el 41,8% de las microempresas, el 53,2% de las pequeñas empresas y el 59,2% de las empresas medianas recortaron el número de empleados y que muy pocas esperaban aumentar el número de trabajadores en los próximos años. Ecuador es la única excepción entre los países para los que se han podido obtener datos, ya que el número de empleados subió de forma generalizada. Aun así, como señala la sección anterior, la distribución del tipo de empresa en Ecuador se ha movido hacia las microempresas.
Las nuevas empresas se crean con menos capital
Datos para Chile muestran que en 2020 y 2021 las empresas de nueva creación tuvieron un nivel de capital mucho menor que en los años anteriores a la pandemia (Figura 5). El capital medio de las empresas cayó un 44,4% entre 2020 y 2019, y se redujo aún más (un 2,7%) en 2021 (la caída es aún mayor si se compara con la media de 2013-2019). Aunque los datos de 2022 (hasta abril) sugieren una ligera recuperación, el capital medio de las nuevas empresas es de 9.500 dólares, el cual es equivalente a sólo el 82% del capital invertido en promedio en 2019.
Figura 5. Capital medio de las nuevas empresas por año en Chile en miles de dólares estadounidenses (2018-2021)
El capital medio de las nuevas empresas cae de forma significativa …
Fuente: Registro de empresas y sociedades.
Los datos de Chile son consistentes con las conclusiones del próximo informe del CGD-BID, que muestra que la inversión en la región ha disminuido notablemente en todos los sectores para las grandes empresas.
En resumen
La inversión y el tamaño de las empresas —tanto en lo que respecta a la distribución de micro, pequeñas, medianas y grandes empresas como al número medio de empleados— son indicadores estructurales clave de la fortaleza y el dinamismo de la economía nacional, que los responsables políticos deberían supervisar y considerar a la hora de diseñar políticas de emergencia y recuperación. La disminución del tamaño de las empresas derivada de la pandemia, que partía ya de una base muy reducida, acentúa la brecha de productividad de la región y añade nuevos obstáculos al crecimiento futuro. El hecho de que la recuperación económica dependa de empresas de un tamaño cada vez menor convierte a América Latina en un gigante con pies de barro.
Liliana Rojas-Suarez es investigadora principal y directora de la Iniciativa para Latinoamérica en el Center for Global Development.
Alejandro Fiorito es un investigador asociado en el Center for Global Development.
[1] "Empresas" se refiere a las empresas formales, salvo que se indique lo contrario.
[2] Leung, Meh, y Terajima (2008) concluyen que el 50% de la diferencia de productividad laboral en el sector manufacturero entre EE.UU. y Canadá se explica por el tamaño de las empresas.
[3] No es una cuestión menor; la experiencia en Chile (Garone et al., 2020) también muestra diferencias considerables en la productividad dentro de las industrias y la persistencia de estas diferencias.
[4] La mala asignación de recursos suele explicar el menor tamaño de las empresas, y algunas estimaciones indican que una reasignación adecuada del capital y el trabajo aumentaría la productividad total de los factores entre un 45% y un 127% en la región. Los estudios llevados a cabo en México y América Latina también relacionan la mala asignación con la prevalencia de la informalidad.
[5] En marzo de 2022 (dos años después del inicio de la pandemia), el empleo formal en numerosos países no había aun recuperado los niveles anteriores a la pandemia; y la informalidad había aumentado. Los datos muestran que las políticas que se han adoptado han sido en gran medida ineficaces a la hora de ayudar a las empresas más pequeñas.
[6] Una cifra negativa implica una destrucción neta de empresas.
Rights & Permissions
You may use and disseminate CGD’s publications under these conditions.


