An energizing development for IMF staff working on sub-Saharan Africa (SSA) over the past decade was the region's clear growth uptick and progress in reducing poverty relative to earlier periods. I was one of those staff. It was simply awesome that a number of "our" countries graduated to lower middle-income country (MIC) status and became "frontier economies." This was the essence of the “Africa Rising” story. But since my time at the Fund, I have pondered whether the IMF has fully adjusted to the evolving financing needs of these countries. I ask this question not from a desire to criticize the Fund (or myself, since I led the African Department's work at the time!), but instead from a desire to offer friendly commentary and advice. I think it’s fair to conclude that this adjustment is a work in progress and that SSA frontier countries can themselves do more to accelerate it.
Posing the Question
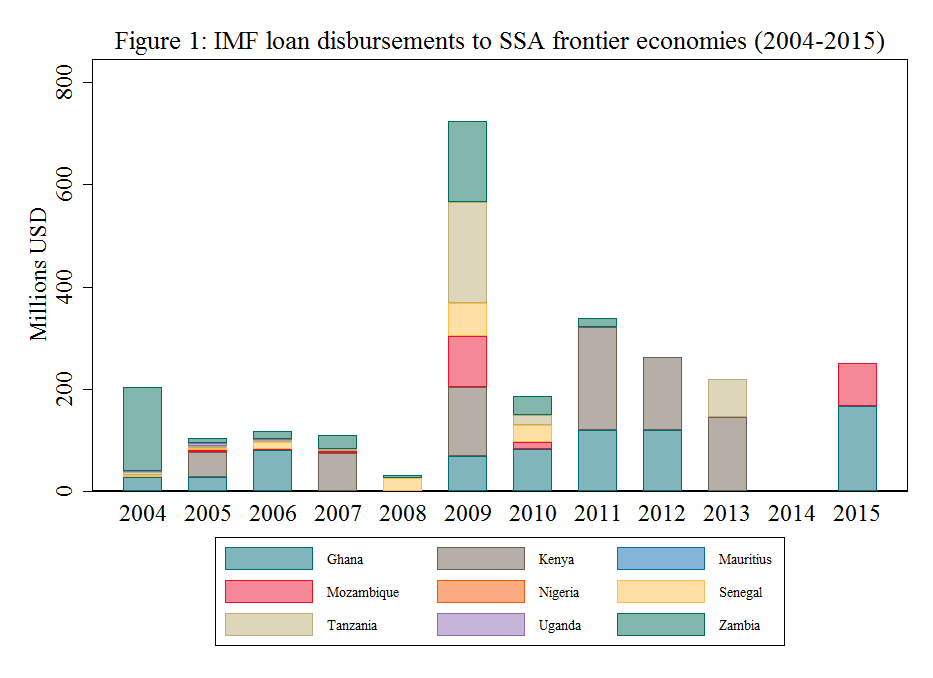
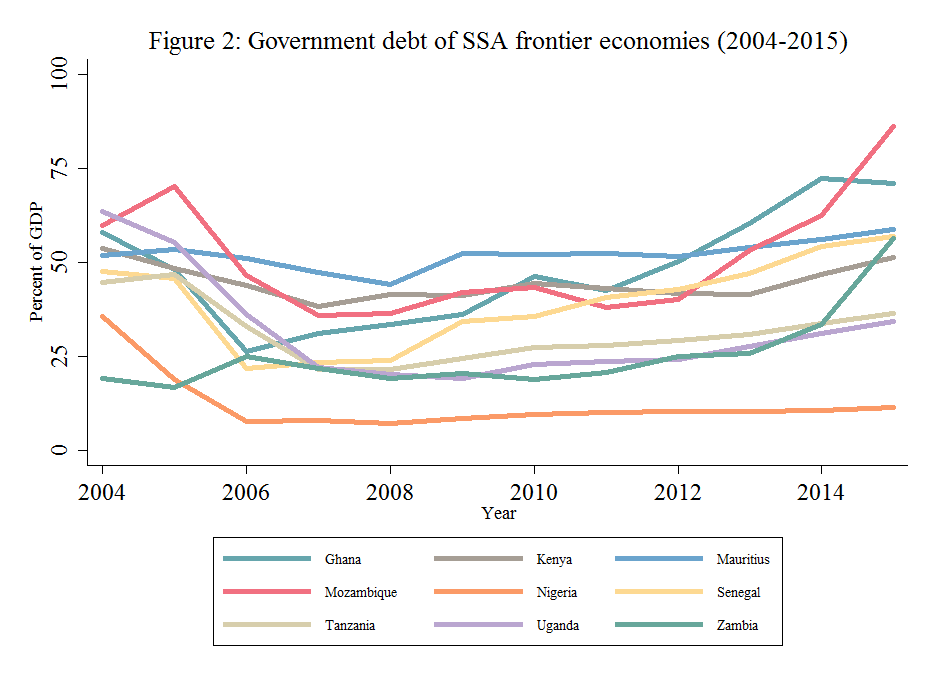
In this my first post-IMF piece, I focus on whether the volume of Fund financing for SSA frontier markets—and for the transitional lower-income MICs in particular—should have been greater, and whether such financing could have helped contain the indebtedness of those countries, many of which issued sovereign bonds (see figures 1 and 2). There isn’t necessarily causality, but it is instructive to consider how responsive the Fund has been to a growing number of SSA countries with increasing market access. Has the Fund actually adapted to the need for non-Poverty Reduction and Growth Trust (PRGT) lending (i.e., for Fund non-concessional or General Resource Account, GRA, lending) to these countries as they climb up the income ladder?
Before delving into this question, it is useful to recall that countries generally benefit from four types of financing: market financing, development financing, exceptional balance of payments financing (when market financing is disrupted or development financing is inadequate), and shock financing (e.g., to address the economic impact of the West African Ebola crisis). Most low-income countries (LICs) do not have sustained access to market financing. Their bilateral and multilateral development partners are their main source of development financing, while the IMF provides them balance of payments and shock financing in exceptional circumstances. LICs are defined as countries with an average per capita GNI in 2013–2015 equal to or lower than $1,025 (World Bank Atlas method).
Since its major overhaul of its lending instruments for LICs at the height of the 2009 global financial crisis, the IMF has regularly reviewed how well those instruments serve LICs, including leading up to the July 2015 UN Financing for Development Conference in Addis Ababa and more recently, in the November 2016 board paper “Financing for Development: Enhancing the Financial Safety Net for Developing Countries—Further Considerations.”[1] As during my time at the Fund, I continue to zero in on these reviews from the SSA perspective, and this time around, specifically from the SSA frontier market vantage point. These countries received significant interest from foreign investors over the past decade and a fivefold increase in net (short-term) private flows in 2010–2012 compared to 2000–2007. By using a broader definition than investment bank indices, the IMF—in its October 2013 SSA Regional Economic Outlook[2]—identifies nine SSA frontier markets: Ghana, Kenya, Mauritius, Mozambique, Nigeria, Senegal, Tanzania, Uganda, and Zambia. Four of these countries—Ghana, Mauritius, Senegal and Zambia—are now classified as MICs, with Mauritius at the upper end and the others recently graduated to MIC status. MICs are defined as countries with a per capita GNI in 2013–2015 of more than $1,025 (World Bank Atlas method). The remaining five countries are LICs. Both LIC and MIC SSA frontier market economies are subject to significant vulnerabilities and external shocks.
Needs on the Frontier
Let’s first review SSA frontier market financing needs since 2009. SSA current account deficits have widened significantly, with those of many countries exceeding 10 percent of GDP since the global financial crisis. At 5.9 percent of GDP for the region as a whole, the 2015 current account deficit stood at its highest level since the early 1980s, increasing from only 2.1 percent in 2013.[4] These trends are also clear in SSA frontier market economies, in which current account deficits moved from an average of 5.5 percent of GDP in 2010 to 10.1 percent of GDP in 2015 (see figure 3).
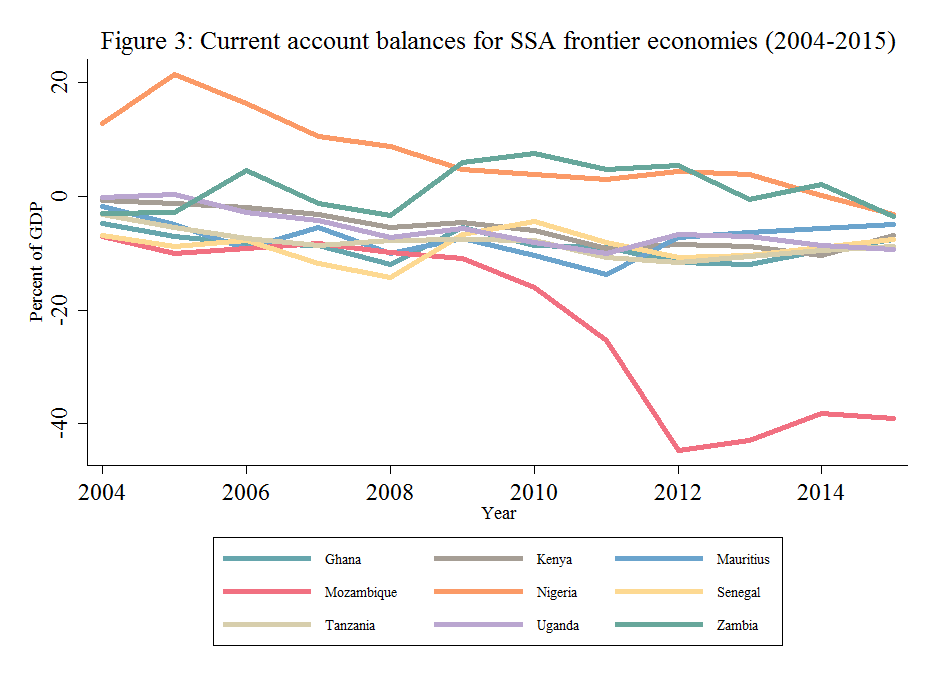
Given the impact of the recent oil and commodity price decline on a number of SSA commodity exporters, it is important to distinguish between the financing needs of those countries versus other SSA frontier market economies. Since 2014, Nigeria and Zambia have seen their current account surpluses collapse into deficits with the shock to oil and copper prices. Notwithstanding the positive impact of the oil price decline on SSA frontier market net oil importers, those countries’ deficits have also remained large; this is essentially because some are exporters of other commodities that have also plummeted in price while most countries have pursued robust import-intensive infrastructure investments. The very large deterioration in Mozambique's deficit is explained by investments related to its future natural resource wealth from gas exploitation.
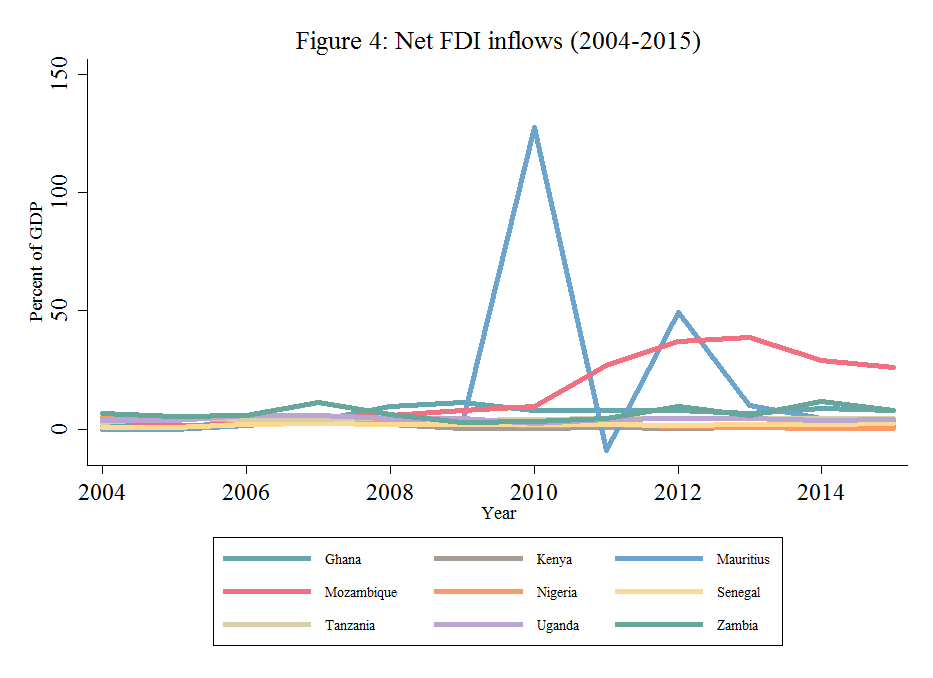
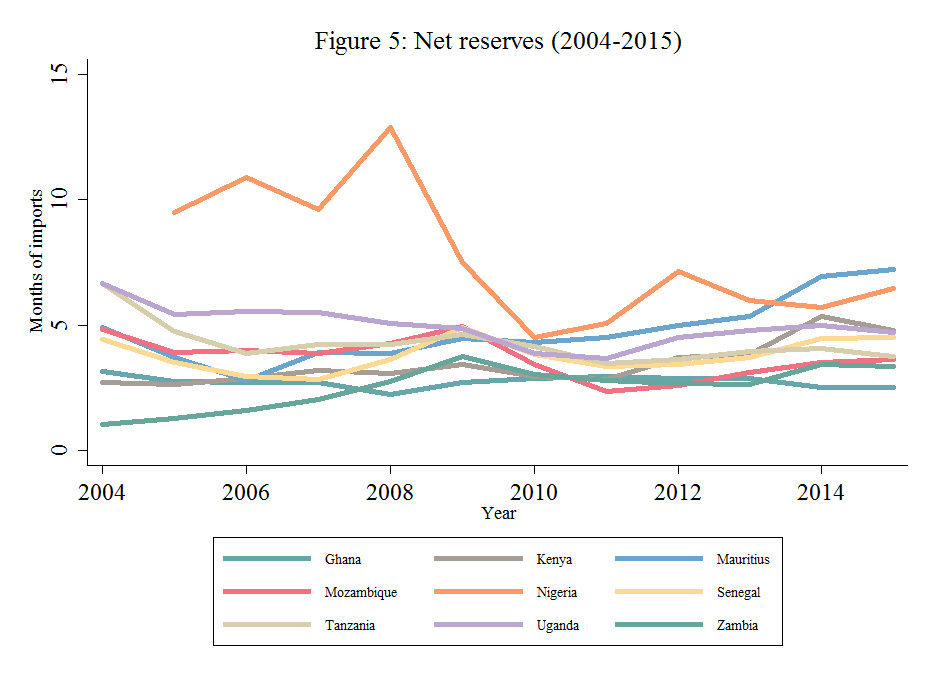
How were these financing needs met? Official data suggest that the bulk of the current account deficits was financed by foreign direct investment (FDI) over the 2009–2015 period (figure 4), while net reserves changed very little during the past decade. As I note above, Mozambique’s deficit was largely financed by the uptick in net FDI since 2010 associated with its future gas wealth. The record increases in Mauritius’s net FDI in 2010 and 2012 (see figure 5) are explained by definitional changes in flows to its offshore center and by their extreme volatility, but also because Mauritius was considered a safe haven during the global financial crisis, thus attracting significant inflows in 2009/2010 as well as in 2012.[5] It is important to note that while SSA frontier market average net reserves have remained stable, Nigeria in particular has experienced deep reductions in reserves due to low oil prices since 2014 and efforts to minimize movements in the exchange rate (see below). Indeed, since 2014, SSA oil-exporting countries have financed about two-thirds of their deficits by drawing down their reserves.
Fund Financing Types
Let's take a closer look at what types of Fund financing are possible for these countries and how they were deployed. With seven of the nine SSA frontier markets below the International Development Association (IDA) “operational cutoff” or ceiling for IDA eligibility ($1,215 for FY2015) and lacking durable and substantial market access, they are all eligible for concessional IMF financing through the PRGT if they demonstrate a balance of payments financing need.[6] The volume of assistance they could receive also hinges on the strength of their reform programs and on their ability to repay the Fund, but it is subject to PRGT access limits.[7] All Fund member countries can, in principle, borrow from the non-concessional GRA. Although encouraged to first draw on PRGT resources, PRGT-eligible countries can resort to the GRA subject to the Articles of Agreement and related policies. They could do so by “blending” PRGT and GRA resources if their financing needs are larger than what PRGT access limits would permit.[8]
Why So Little Blending?
SSA frontier market balance of payments financing needs have been significant since 2009 and six countries have drawn on Fund (PRGT) resources. But only Kenya has made use of blending through access to GRA resources to supplement those from the PRGT.[9] Members can use both GRA and PRGT instruments (SBA or SCF) on a precautionary or disbursing basis to address potential or actual balance of payments needs, respectively. Fund financing to frontier market countries amounted to only $2 billion, compared to total financing of $66 billion that these countries drew on from 2009–2015.[10] A number of factors explain this limited use of Fund resources. Some countries, like Mauritius, demonstrated little or no balance of payments financing need over the period. Others (e.g., Uganda and Senegal since 2010) made use of only the Policy Support Instrument (PSI), which is the nonfinancial Fund instrument for LICs. Although use of the PSI is seen as a mark of “mature stabilizers,” it is reasonable to ask why these countries did not go beyond that instrument to request Fund financing. The increased interest in exploring precautionary blend financing from the Fund since 2015 when Kenya first benefitted from it (see below) suggests that these countries attach less value to (limited) PRGT-only financing but are eager to explore insurance against external shocks through blended PRGT/GRA support.
Finance Beyond the Fund
In the context of significantly more favorable global market conditions of low interest rates and low risk aversion, three main factors underpinned increased sovereign bond issuance by SSA frontier market countries over the past decade: deficit financing (including for scaling up infrastructure spending), external debt restructuring, and benchmarking. Except for Mauritius and Uganda, all SSA frontier market countries issued sovereign bonds between 2007 and 2016, with the brunt of the focus on infrastructure financing and record issuances in 2014 and 2015. As a result, Eurobonds now account for an appreciable share of the total public debt stock in some SSA frontier market countries, such as Zambia (24 percent), Ghana (16 percent), and Senegal (15 percent).[11]
What role did limited PRGT and GRA blending availability play in containing SSA frontier markets’ requests for Fund finance? Did the absence of conditionality explain their recourse to sovereign bond financing? Has the stigma of IMF-supported programs had an impact? Apart from Nigeria, it is difficult to argue that stigma or avoiding Fund conditionality motivated the limited use of Fund resources. The PSI-only countries, in fact, implemented demanding ("upper credit tranche") conditionality, as did the other countries benefitting from PRGT financing. With infrastructure financing as the focus of much of the bond issuance and limited financing from traditional partners, capitalizing on the availability of lower interest rates (at the time) and larger amounts would appear to be the overriding motivating factor.
In Nigeria's case, stigma and avoidance of Fund conditionality were manifest, particularly in its decision to not approach the Fund for help in coping with the oil price shock since 2014. Nigeria’s reluctance to permit its exchange rate to move flexibly and to increase the value-added tax rate (to expand its very limited non-oil revenues) have reflected its significant difference of views with the Fund. Nigeria has instead drawn down its reserves and received some budget support from the African Development Bank in 2016. Despite repeated statements of its intention to negotiate a Fund program, Zambia’s significant use of sovereign bonds and its continued postponement of discussions on Fund financing also aimed to avoid necessary adjustment and the associated Fund conditionality. This was especially true in the run-up to the August 2016 elections.
Multiple Finance Streams
Ghana and Kenya are two important examples of SSA frontier market countries that borrowed from the Fund while obtaining considerable financing from international sovereign bonds. Losing market access after its maiden issue in 2007 at a fiscally strained time, Ghana turned to the Fund for a three-year assistance program in 2009 and again in 2015. While the latter program was at the higher end of PRGT access limits (in line with the strength of the agreed program), the $918 million or 180 percent of quota made available to Ghana did not amount to “exceptional access.”[12] Ghana could have benefitted from more financing through blending with GRA resources. However, the Fund rationalized that this option should be ruled out because of Ghana’s “high rate of debt distress” rating.[13] Ghana regained market access and resorted to additional sovereign bond issuance to meet its remaining financing needs in each of the four years between 2013 and 2016. It pursued this financing option despite the increased cost
in 2015/2016. Since reaching about 9 to 10 percent in late 2016, the cost of this financing (sovereign yields on secondary markets) now exceeds what would have been the GRA charge. PRGT/GRA blending for Ghana may have therefore been better suited to mitigating debt sustainability concerns.
Kenya issued its debut Eurobond of $2 billion in June 2014, followed by a re-tap of $750 million six months later with a major infrastructure financing focus. At low risk of debt distress, Kenya succeeded in making the case for the first SSA precautionary blend PRGT/GRA arrangement in the amount of $688 million or 180 percent of quota in 2015, and its second one totaling $1.5 billion or 196 percent of quota in 2016. The latter amount is more than would have been possible with a PRGT-only arrangement. [14] While Kenya’s first bond was the largest to date for a SSA country, it was still prudent in its bond issuance, notwithstanding significant market interest.
More Fund Frontier Finance
Except for Nigeria and Zambia, SSA frontier markets’ limited access to IMF financing is not explained by attempts to avoid conditionality. Instead, more favorable market conditions and the availability of larger volumes of financing from sovereign bond issuance (than from traditional and new partners) were the factors at play. Had more PRGT financing or blending been available, however, Ghana might have opted to raise less financing through sovereign bonds, especially in 2016 when yields increased. Blending appears to have played some role in Kenya’s more prudent approach to bond issuance, including in 2016. The less favorable global market conditions resulted in Ghana being the only SSA frontier market issuer that year. These conditions and greater investor risk aversion mean that frontier market countries will likely have more recourse to IMF financing and need for blending going forward. Indeed, over the past two years, SSA ministers of finance have been increasingly vocal about easing their countries’ access to GRA resources.
The Fund has recently been more attentive to these concerns. In advance of the July 2015 Financing for Development conference, it outlined its intention to tweak the blending policy, primarily to safeguard limited PRGT funding for the poorest countries while also permitting increased financing for needy frontier market economies through access to GRA resources. The November 2016 Board paper clarifies the blending policy, but it does not suggest that there will be any dilution of the blending criteria. But the Ghana case suggests that a more forward-looking perspective on debt sustainability could have been useful, permitting Ghana to benefit from some PRGT/GRA blending and to make less use of (now more costly) sovereign bonds. For their part, frontier market authorities should fully absorb the lessons from the worsening of market conditions following what, in some cases, was a rush to bond issuance: they must be highly attentive to debt sustainability concerns in their borrowing and investment choices while pushing for and maximizing opportunities to draw on Fund resources that are well-placed to help them address unexpected balance of payments needs and shocks.
My appreciation to Jennifer Richmond for research, data analysis, and editorial support.
Endnotes
[1] See: Financing for Development: Enhancing the Financial Safety Net for Developing Countries – Further Considerations. Washington, DC: IMF, 2016. www.imf.org/en/Publications/Policy-Papers/Issues/2016/12/31/Financing-for-Development-Enhancing-the-Financial-Safety-Net-for-Developing-Countries-PP5076.
[2] See: Regional Economic Outlook, October 2013, Sub-Saharan Africa: Keeping the Pace. Washington, DC: IMF, African Department, 2013 (pp. 55-56). www.imf.org/en/Publications/REO/SSA/Issues/2017/01/07/Regional-Economic-Outlook-October-2013-Sub-Saharan-Africa-Keeping-the-Pace-40866.
[3] “Past IMF Disbursements and Repayments for all members from May 01, 1984 to January 31, 2017.” IMF. 2017. www.imf.org/external/np/fin/tad/extrep1.aspx.
[4] See: Regional Economic Outlook, October 2016, Sub-Saharan Africa: Multispeed Growth. Washington, DC: IMF, African Department, 2016. www.imf.org/external/pubs/ft/reo/2016/afr/eng/sreo1016.htm.
[5] The offshore center or Global Business Centers (GBCs) are split into GBC1 and GBC2, with entities in the former classified as residents and those in the latter non-residents. A decision was made around 2010 to update the statistical coverage in the balance of payments to start accounting for flows within the GBC1 segment.
[6] Mauritius does not meet these criteria and is therefore not eligible for PRGT financing; Nigeria is also not eligible as it was “graduated” from PRGT financing in July 2015.
[7] The normal access limits for all PRGT facilities as of late January 2016 was 225 percent of quota on a cumulative basis and 75 percent of quota on an annual basis. “Access norms” are also used to determine the level of PRGT financing but are neither ceilings nor floors. See IMF November 2016 Board paper.
[8] One-third of PRGT eligible members are considered “presumed blenders,” meaning they could access PRGT resources only by a mixture with GRA resources, whereas the remaining “non-presumed blenders” are entitled to comprehensive PRGT support up to the access limits.
[9] The six frontier market countries drawing on PRGT resources between 2009–2016 were Ghana, Kenya, Mozambique, Senegal, Tanzania, and Zambia, with only the first two countries having more than one financial arrangement. Kenya benefited from a blending of PRGT and GRA resources through a precautionary Standby Credit Facility/Standby Arrangement (SCF/SBA).
[10] These are the author’s calculations based on data from the IMF October 2016 SSA Regional Economic Outlook and the IMF’s past disbursements and repayments data (see endnote 4).
[11] See p. 10 of October 2016 Regional Economic Outlook. Nigeria issued to provide a benchmark for other government financing, using Eurobond secondary market trading as a benchmark. After the big infrastructure focus of its earlier issues, Ghana’s 2015 and 2016 bonds also had a debt restructuring objective.
[12] Exceptional PRGT access is capped at 300 percent of quota on a cumulative basis and at 100 percent on an annual basis. Ghana’s access level of 180 percent of quota approved in 2015 is now equivalent to 90 percent following the doubling of IMF quotas upon approval of the 14th quota review in early 2016.
[13] The risk of debt distress assessment is conducted by the Joint World Bank/IMF Debt Sustainability Analysis (DSA) for the latest available year and ranks countries as low, medium, or high.
[14] Kenya’s new quota in 2016 stood at SDR 542.8 million, having doubled upon approval of the 14th quota review. Hence the $1.5 billion approved is a relatively low percentage of quota equivalent compared to the $688 million equivalent approved in 2015. Liberia is the only SSA country to have benefitted from a blend program with exceptional access of $952 million or 450 percent of quota in 2008 aimed at clearing its large long-standing arrears to the Fund. See: Liberia: Enhanced Initiative for Heavily Indebted Poor Countries—Decision Point Document, Debt Sustainability Analysis, and Staff Supplement. Washington, DC: IMF, Country Report No. 08/106, 2008. www.imf.org/external/pubs/ft/scr/2008/cr08106.pdf.
Rights & Permissions
You may use and disseminate CGD’s publications under these conditions.