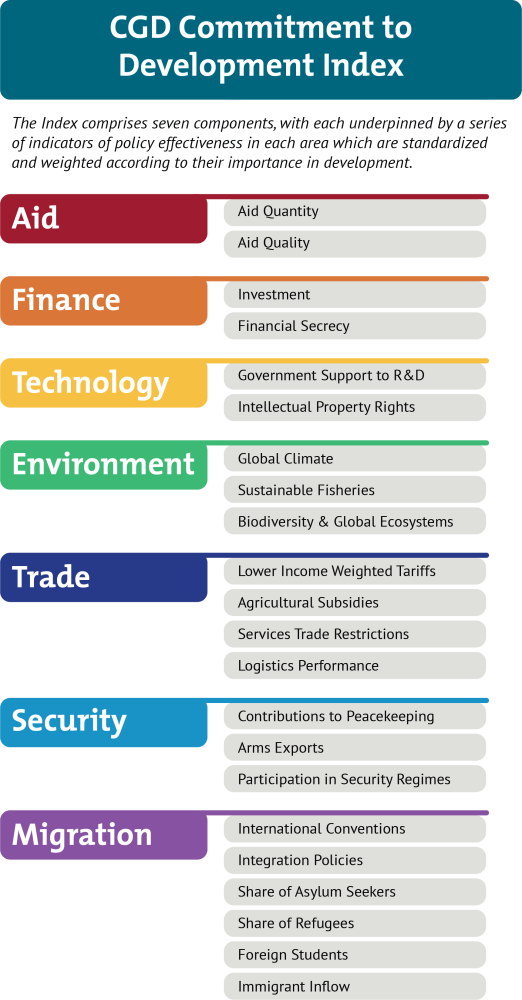
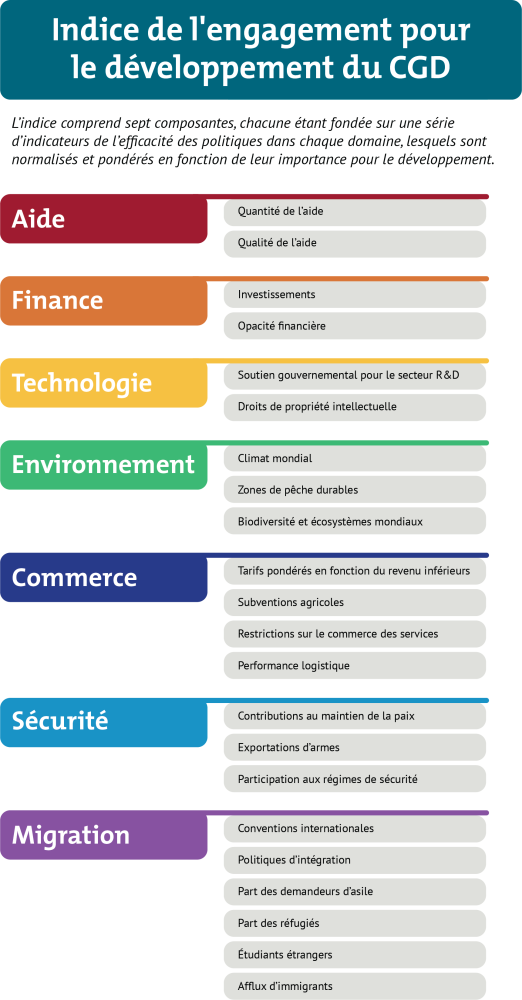
The Commitment to Development Index ranks 27 of the world’s richest countries on policies that affect more than five billion people living in poorer nations. Because development is about more than foreign aid, the Index covers seven distinct policy areas:
- Aid
- Finance
- Technology
- Environment
- Trade
- Security
-
Migration
Why Does Commitment to Development Matter?
In our integrated world, decisions made by the richest countries about their own policies and behaviour have repercussions for people in lower-income nations. At the same time, greater prosperity and security in poorer countries benefit the whole world. They create new economic opportunities, increase innovation, and help reduce risks posed by public health, security, and economic crises. The Commitment to Development Index (CDI) celebrates high-income countries whose policies benefit not only themselves, but also the development of others and promote our common good.
How do we calculate the Commitment to Development Index?
We use thousands of data points across more than a hundred indicators to come up with overall rankings and for each policy component. Countries score well for things like generous and high-quality aid, financial transparency, low barriers to trade for developing countries, and migration policies which are open and promote integration. They also do well for policies that enhance global public goods, for example, robust support for technological research and development, protecting the environment, and contributions to global security like peacekeeping contributions and avoiding arms sales to poor and undemocratic nations.
Like the Sustainable Development Goals, the CDI recognizes development progress is holistic. But while the SDGs focus on outcomes and all nations, the CDI emphasizes how the policies of the richest countries can make a huge difference.
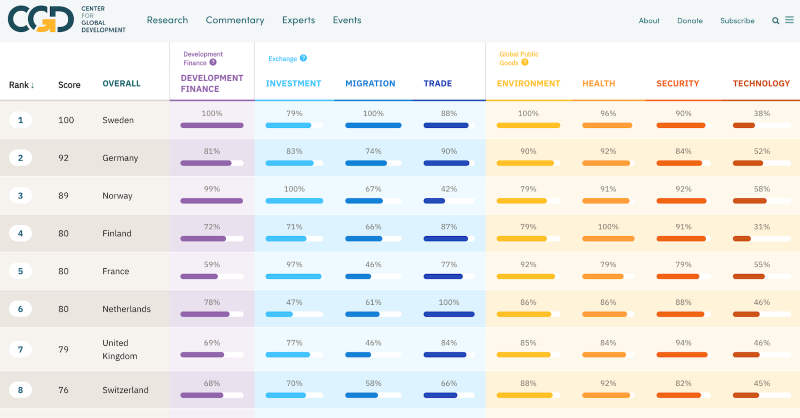
CDI 2018 Results: How Well Are Countries Doing?
Sweden tops this year’s Commitment to Development Index, followed by Denmark. Germany climbs to the podium and shares third place with Finland.
Sweden scores well across six out of seven components of the CDI, ranking first on migration, second on environment, and third on aid. It has room for improvement on security, given its substantial arms exports and low contributions to international peacekeeping and sea lanes protection.
Denmark comes second this year, topping the list on security and with the second-best aid score. Finland and Germany share third place. Finland scores consistently well across nearly all components. Germany scores particularly well on migration and trade, with the most efficient trade logistics and the least restrictions on trade in services. However, Germany could improve its aid quality and its contributions to international security.
European countries lead the way.
European countries take up the first 12 positions on the Index, highlighting European leadership on development issues. France comes seventh this year, with good performance across all components. It is one of the few countries which has increased its aid spending, by 0.05 percent to 0.43 percent of gross national income (GNI). The United Kingdom, in eighth place, is the third G7 country in the top 10, scoring especially well on trade and security. The UK is one of the few countries meeting the international commitment of 0.7 percent of GNI spent on overseas development assistance but ranks in the lower end of the table on technology and migration.
The Netherlands and Luxembourg share position five and Belgium ranks 10th. All three countries have smart policy designs in place: Luxembourg tops the aid component; the Netherlands the trade component; and Belgium the finance component. Portugal, in ninth position, demonstrates that commitment to development isn’t for the richest only.
Despite its contribution to global security, the United States ranks 23rd of 27.
Like last year, the United States scores close to the bottom of the table, performing poorly on finance, aid, and environment, with high greenhouse gas emissions, significant fossil fuel production, and the lowest gasoline taxes. Its best performance is on security as the biggest contributor to global sea lanes protection and a major supporter of international peacekeeping. However, its security score is held back for failing to ratify most international agreements, including the Arms Trade and Nuclear Test Ban treaties. Our trade data predate the recent protectionist trade policies implemented by the US government, resulting in the US scoring above average on trade, with low agricultural subsidies and average tariffs. The US’s stated withdrawal from the Paris agreement only comes into effect in 2020 but will lower the US score further.
Poland, Greece, and South Korea are at the bottom of the CDI.
Even countries ranked near the bottom provide lessons for others on supporting development. South Korea ranks last on the CDI. Its performance on trade, environment, and security are the lowest in the CDI. However, with its extraordinary support for innovation and research and development, it maintains its position at the top of the technology component.
Greece comes second to last, with performances below average on most components, but it leads the way on low gasoline taxes and is rewarded for its openness to asylum seekers. Poland, in position 25, lags on technology, migration, and aid, but tops the league on biodiversity protection.
Netherlands, Germany, and Australia are the leaders on trade, and most countries’ trade tariffs are lower against the poorer countries.
The 2018 CDI data predate the most recent round of tariffs implemented by the US. The Netherlands, Germany, and Australia are respectively the top three on trade. The Netherlands has low tariffs, good trade logistics (such as infrastructure and customs procedures), and open trade in services. It also has lower agricultural subsidies than Germany. Australia has low tariffs, open trade in services, and low agricultural subsidies, but relatively poor trade logistics.
This year, the CDI took a new approach to measuring trade tariffs, which gives a higher weight to those levied against lower-income countries. On this basis, tariff levels have been relatively stable for the past decade and CDI countries’ tariffs tend to be progressive—that is, lower against the very poorest of their trading partners and higher against the richest.
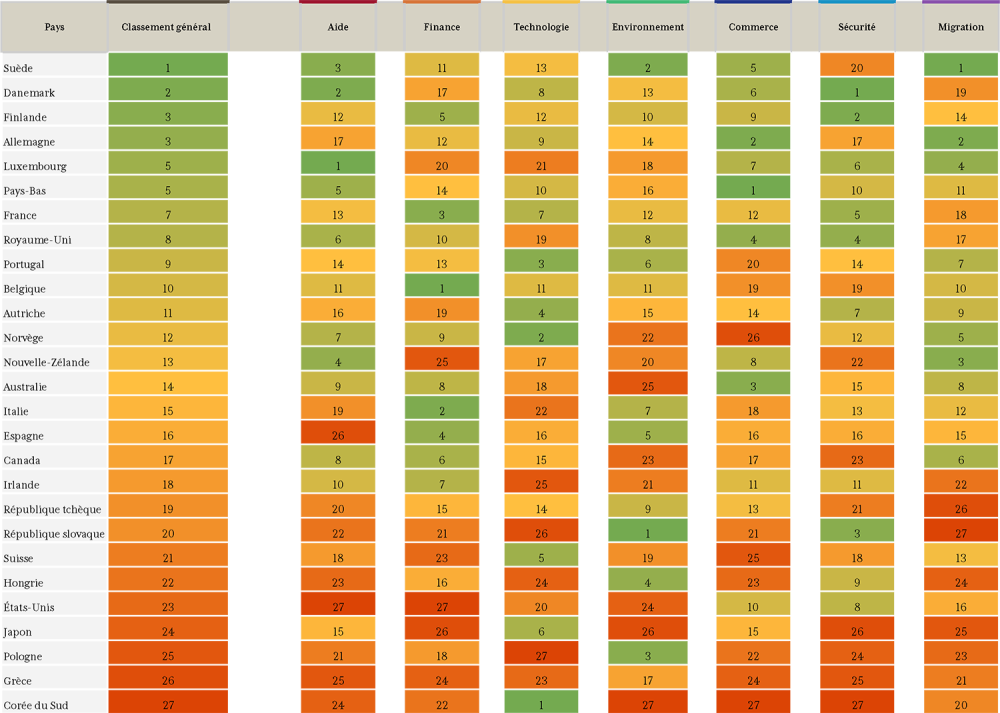
Commitment to Development Index 2018

The table above ranks each of the 27 CDI countries across seven policy areas. View the interactive results here.
Aid
Foreign assistance remains an important source of finance for some of the poorest countries, so the CDI rewards countries that give more aid than their peers as a share of their GNI. The CDI measures the quality of aid with the revised Quality of Official Development Assistance (QuODA) assessment, which uses 24 indicators that reflect accepted aid-effectiveness principles of maximising impact, fostering institutions, reducing burden, and promoting transparency. A country’s aid quality score is the combination of its bilateral QuODA score and the QuODA scores of the multilateral agencies to which it disburses aid.
Aid plays a critical role in saving lives and helping life millions out of extreme poverty. Let’s protect and expand this vital investment. #Commit2Dev @CGDev
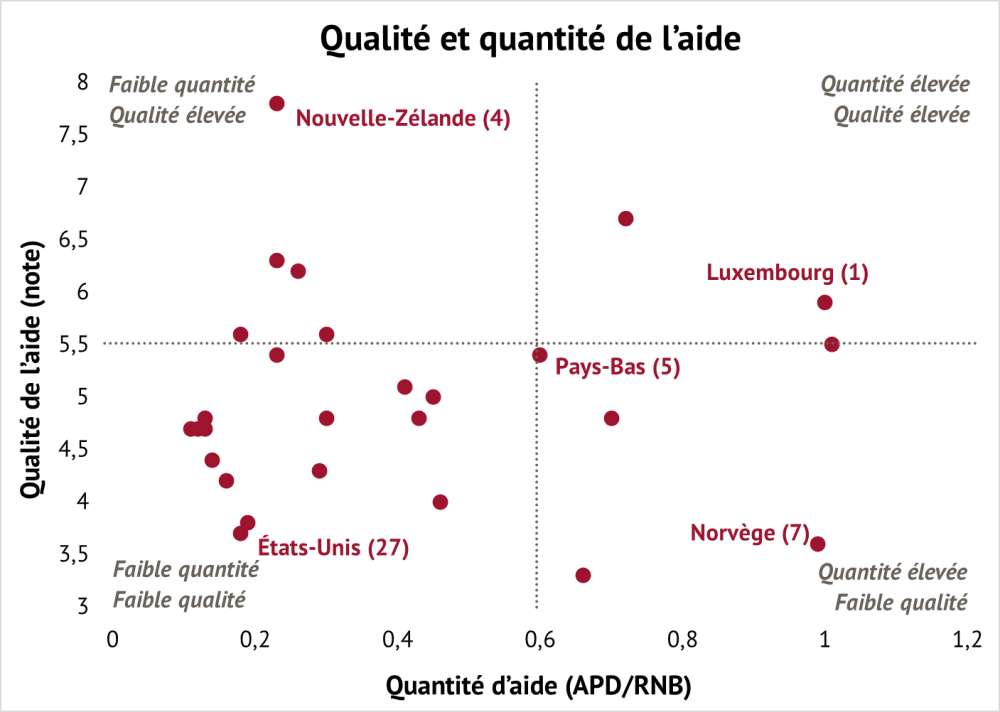
Tweet ThisWhile few countries are strong on both quantity and quality of aid, Luxembourg ranks at the top of this component—providing a full 1 percent of national income and scoring well on the quality of its bilateral aid. Sweden also performs well, while Hungary provided the least (0.11 percent of its GNI). The United States has the greatest room for improvement. Despite being the largest donor in absolute terms, it provided just 0.18 percent of its GNI for aid, and although it disburses aid to effective multilateral agencies, US bilateral aid scores poorly. New Zealand ranks highest overall in aid quality, with extremely effective bilateral aid. South Korea, Japan, and Canada disburse aid to the most effective multilateral institutions.
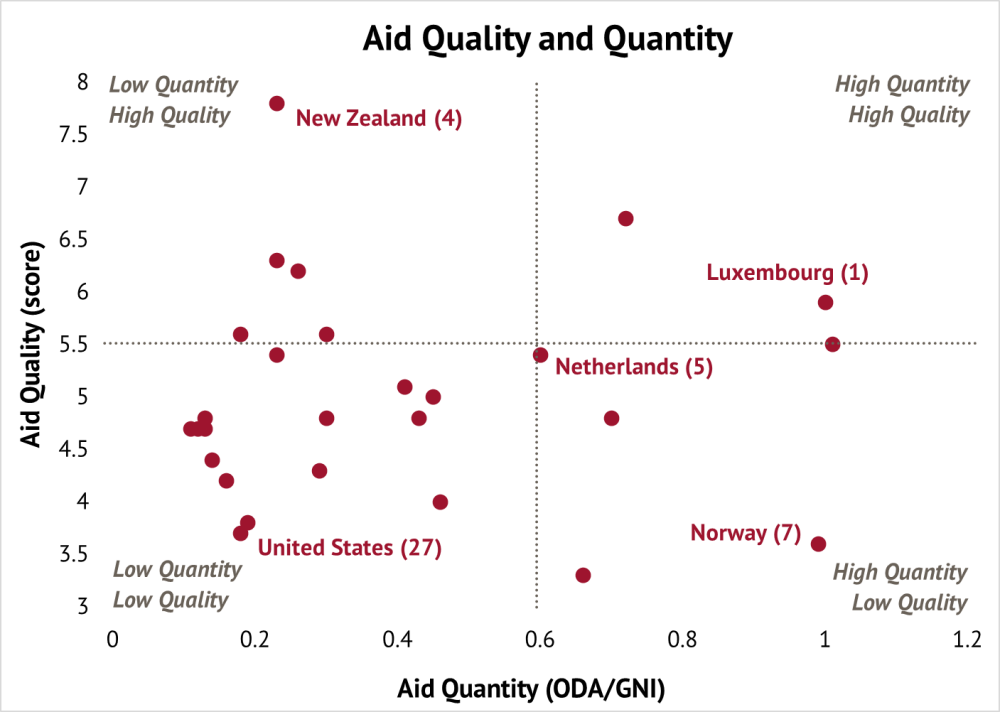
Numbers in parentheses indicate the country’s rank in the aid component.
Finance
Foreign direct investment is the largest source of financing for many developing countries. The CDI rewards wealthy countries with policies that support investment and those that sign on to international commitments (including preventing bribery and safeguarding human rights) but do not undermine partner countries’ ability to develop sustainable public policy. Policies that allow for financial secrecy, in contrast, enable tax evasion, money laundering, and corruption, and degrade governance and international security; these are assessed using selected indicators from the Financial Secrecy Index.
Belgium ranks first on finance thanks to its international commitments on investments and transparency in the financial sector; Italy and France take the next two places. The United Kingdom ranks above average but would significantly improve its score if its overseas territories and crown dependencies moved in line with the rest of the UK. Spain is the most transparent financial jurisdiction, followed by Italy and Ireland.
Foreign investment may be the largest source of financing in most developing countries, but its impact can be small without sustainable and transparent policies. #Commit2Dev @CGDev
Tweet ThisTechnology
Medicine, sustainable energy, information and communication technology, and other technological advances improve the lives of all. Technologies invented in rich countries, such as vaccines, mobile phones, and high-yielding grains, have improved—and saved—many lives. But advanced economies can also impede the diffusion of knowledge and technology with restrictive protections for intellectual property rights. The CDI penalises countries for policies that can inhibit the international flow of innovations but rewards government support for research and development (R&D).
South Korea, Norway, and Portugal are top performers on the technology component. All three countries are committed to high levels of government and incentives for business expenditure on R&D. South Korea’s policy environment supports business expenditures on R&D of over 3 percent of GDP, and the direct government support to R&D reaches 1.5 percent of GDP. Poland ranks last, spending less than 0.2 percent of GDP on government support to R&D. New Zealand’s legislation on intellectual property rights (IPR) is the most development friendly, followed by Canada. Greece performs poorly on the IPR subcomponent, with room for improvement especially on its rights-loss provisions.
Technology not only drives development, it can save lives. #Commit2Dev #globaldev @CGDev
Tweet ThisEnvironment
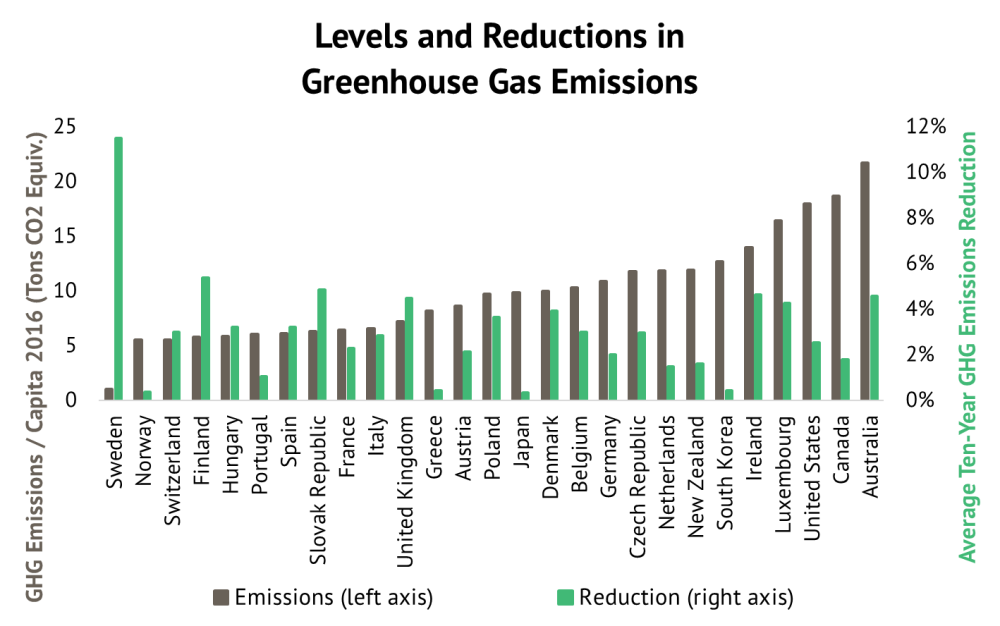
Rich countries are most responsible for climate change, but poorer countries will suffer most. They are more susceptible geographically, have fewer resources and less state capacity to deal with the effects, and many more of their people depend directly on the environment to meet their daily needs. The CDI rewards countries for decreasing greenhouse gas emissions, implementing high gas taxes, not subsidizing their fishing industries, cutting imports of illegally harvested timber, and committing to important international conventions. These measures benefit all countries.
Slovak Republic is the CDI leader on environment policies, with gasoline taxes and greenhouse gas emissions reductions among the best. Sweden did best overall on controlling climate change, but high fishing subsidies held it back from the top position. Poland is in third place partly due to its low fishing subsidies and high gasoline taxes.
Those who contribute the least will be impacted the most by climate change. Better environmental policies benefit us all. #Commit2Dev @CGDev
Tweet ThisSouth Korea takes last place with limited commitment to biodiversity, high imports of tropical timber, and high consumption of hydrochlorofluorocarbons. Japan and Australia also import significant amounts of tropical timber and are towards the bottom of the environment table.
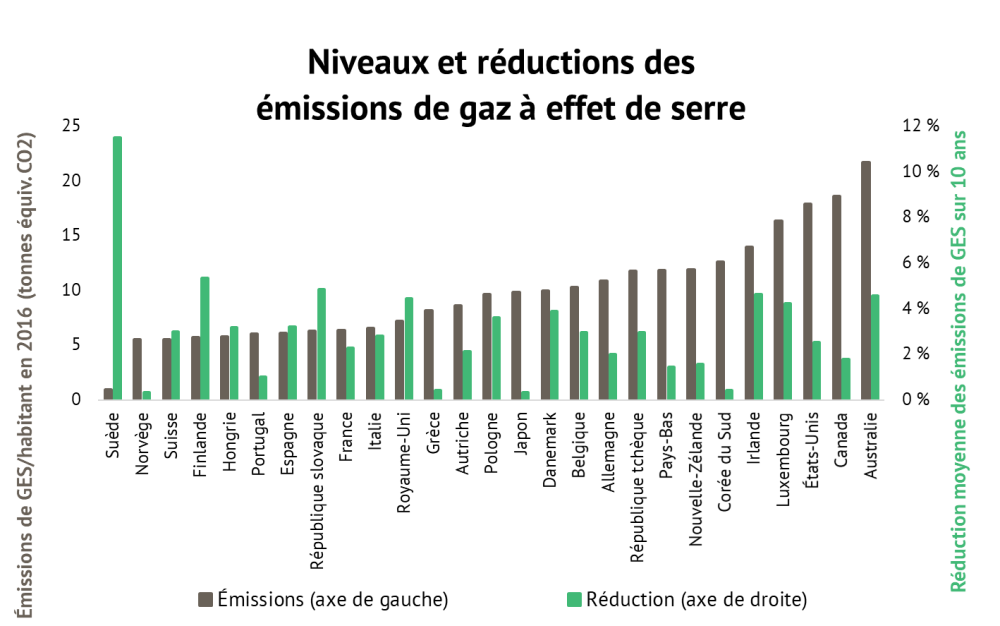
The chart below draws on two of the CDI’s indicators on greenhouse gas emissions and compares current emissions and historic reductions. Sweden has made great strides in reducing emissions, while Norway has low but largely unchanged emissions. Conversely, Ireland and Luxembourg have substantially reduced emissions, but they remain high relative to others.
Trade
Trade provides poorer countries with opportunities to attract investment, create jobs, and reduce poverty. With rich countries in control of the largest markets, some goods and services from poorer countries still face trade barriers. High tariffs, subsidies that create an uneven playing field for agricultural goods, and burdensome red tape and legal restrictions make trade harder for developing countries. The CDI rewards wealthy countries most open to goods from developing countries, with low tariffs, few agricultural subsidies, and streamlined importation processes. These policies benefit consumers and taxpayers in all countries.
The Netherlands scores best on trade with low agricultural subsidies, strong trade logistics, and openness to trade in services. As a member of the EU Customs Union, the Netherlands also has relatively low tariffs. Germany and Australia rank second and third respectively.
Good trade practices attract investments, create jobs, and reduce poverty – something we can all benefit from. #Commit2Dev @CGDev
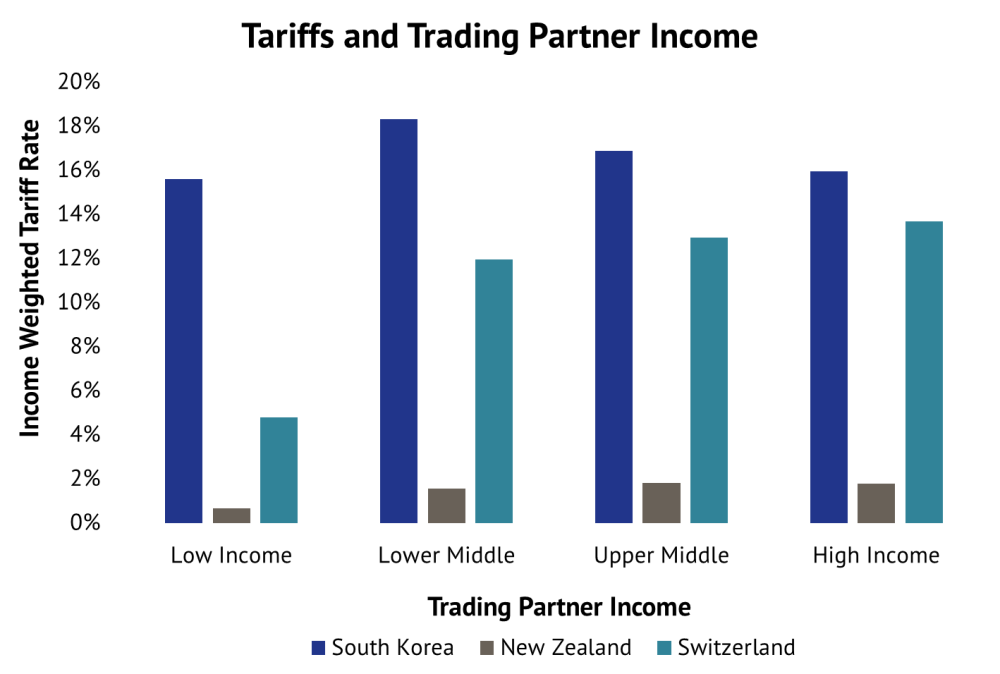
Tweet ThisSwitzerland, Norway, and South Korea are at the bottom of the trade table. They have the highest tariff rates, limiting market access for developing country producers.
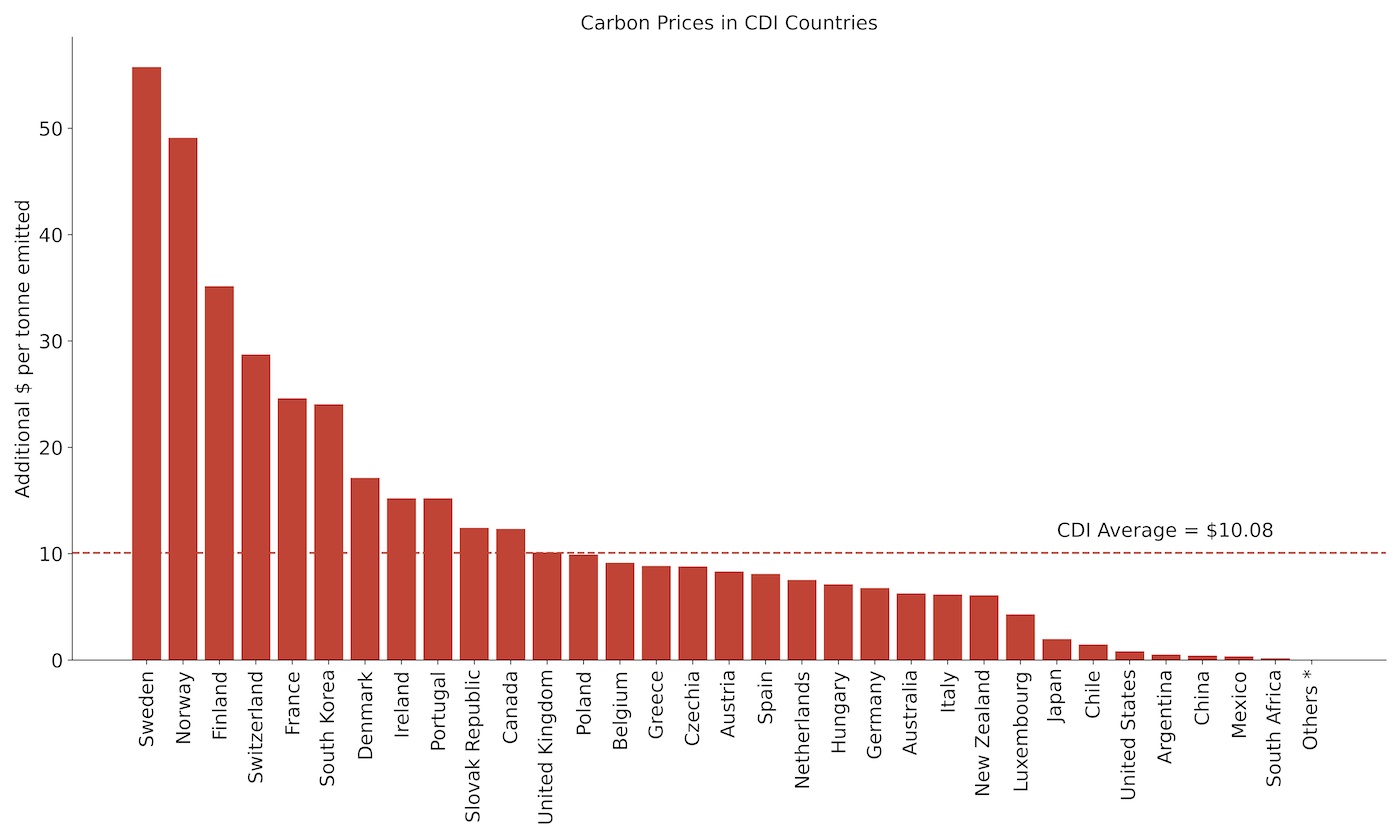
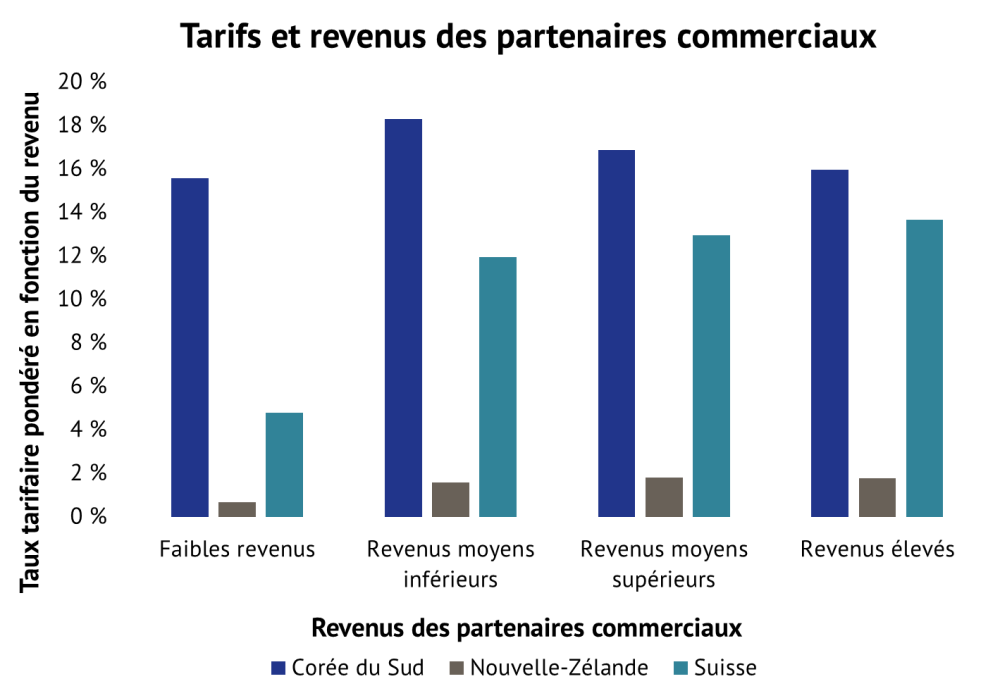
For the 2018 CDI, we weight tariffs by trading partner income for the first time, with tariffs against the poorest country weighted at one and those against the richest countries tending to zero. The chart below draws from the data. South Korea has high tariffs which tended to be lower against richer trading partners than against middle-income ones. Swiss tariffs were very high but were the most progressive of all CDI countries—they tended to rise with trading partner income. New Zealand scored best on this indicator with tariffs which were both progressive and low in absolute terms.
Security
Security and development are closely linked. War and political violence can destroy livelihoods and public institutions, while poverty and institutional weakness make it easier for violence to erupt. It is in the interest of all countries to support peace and international security. The CDI rewards countries for contributing to peacekeeping and humanitarian interventions, basing naval fleets where they can secure sea lanes, and participating in international security regimes that promote non-proliferation, disarmament, and international rule of law. The CDI penalizes countries for some arms exports, especially to nations with undemocratic regimes, and for not publishing data on arms exports.
Denmark leads on security as it is a significant contributor to internationally sanctioned peacekeeping and humanitarian interventions. Finland ranks second and also makes significant contributions to peacekeeping and humanitarian interventions alongside low exports of arms to undemocratic lower-income countries. The United States contributes most to security in absolute terms and the largest proportion of GDP to international sea lanes protection.
South Korea ranks last on security because of its limited contributions to international peacekeeping efforts and incomplete support for the international security regime. South Korea, Australia, Greece, Japan, and New Zealand were penalised for a lack of recent and detailed data on arms exports. Among CDI countries that published data, the Czech Republic exported the highest level of arms to poor and undemocratic countries.
Rich countries have the power to enhance or degrade the security of people in developing countries. Peacekeeping and humanitarian interventions mean we ALL benefit. #Commit2Dev @CGDev
Tweet ThisMigration
Labour mobility is potentially the most powerful tool for poverty reduction and income redistribution. By migrating to richer countries, workers increase their productivity through pairing their skills with capital, leading to higher incomes. They send billions of dollars home each year, a flow that surpasses foreign aid. The receiving country also benefits from migrants’ economic and social contributions. The CDI rewards countries for welcoming migrants and students from developing countries, accepting refugees and asylum seekers, embracing sound migrant integration policies, and joining international conventions protecting the rights of migrants.
Sweden scores highest overall on the migration component, strengthened by its integration policies and acceptance of refugees and migrants from poorer countries. Germany, ranking second overall on migration, accepts most refugees, Austria has the most generous rate of accepting asylum seekers.
Migrants from poor to rich countries send billions back to their families, a flow surpassing foreign aid. Let’s prosper together. #Commit2Dev @CGDev
Tweet ThisFor Country Reports and Full Results
Visit cgdev.org/cdi to explore the Commitment to Development Index, including full country reports, interactive web portal, full calculations, and method paper.
About the CDI
The Center for Global Development (CGD) has compiled the Commitment to Development Index each year since 2003. The Center for Global Development works to reduce global poverty and improve lives through innovative economic research that drives better policy and practice by the world’s top decision makers. CGD Europe deputy director and senior policy fellow Ian Mitchell directs the Index, building on the work of CGD vice president Owen Barder, and of former senior fellow David Roodman. Anita Käppeli, CGD’s director of policy outreach for Europe, composes and leads the development of the CDI. The Index is supported by the CDI Consortium, which in 2018 included Australia, Denmark, Germany, Luxembourg, and Sweden. The content of this report does not reflect the official opinion of the Consortium members. Responsibility for the information and views expressed herein lies entirely with the authors.
Rights & Permissions
You may use and disseminate CGD’s publications under these conditions.