Executive summary
With over 22 million refugees around the world, displaced on average for over 10 years, policymakers are looking for more sustainable solutions to refugee crises.[1] One promising approach is to expand economic opportunities for refugees in developing countries, which host 85 percent of the world’s refugees.[2] In recent years, governments, donors, and private sector actors have been finding innovative ways to include refugees in labor markets, thus enabling them to become more self-reliant, reducing the cost of hosting refugees and creating economic benefits for hosts.[3]
Multinational corporations (MNCs) are emerging as important partners in the push to expand refugee employment and entrepreneurship. As market leaders with global reach through hiring and supply chains, policy influencers, and innovators, MNCs have distinctive capacities for engagement that do not exist within the traditional refugee response community.[4] MNCs are also well positioned to participate in broader jobs and livelihoods initiatives that support both refugees and the communities hosting refugees, which often struggle with high unemployment and limited economic opportunities.
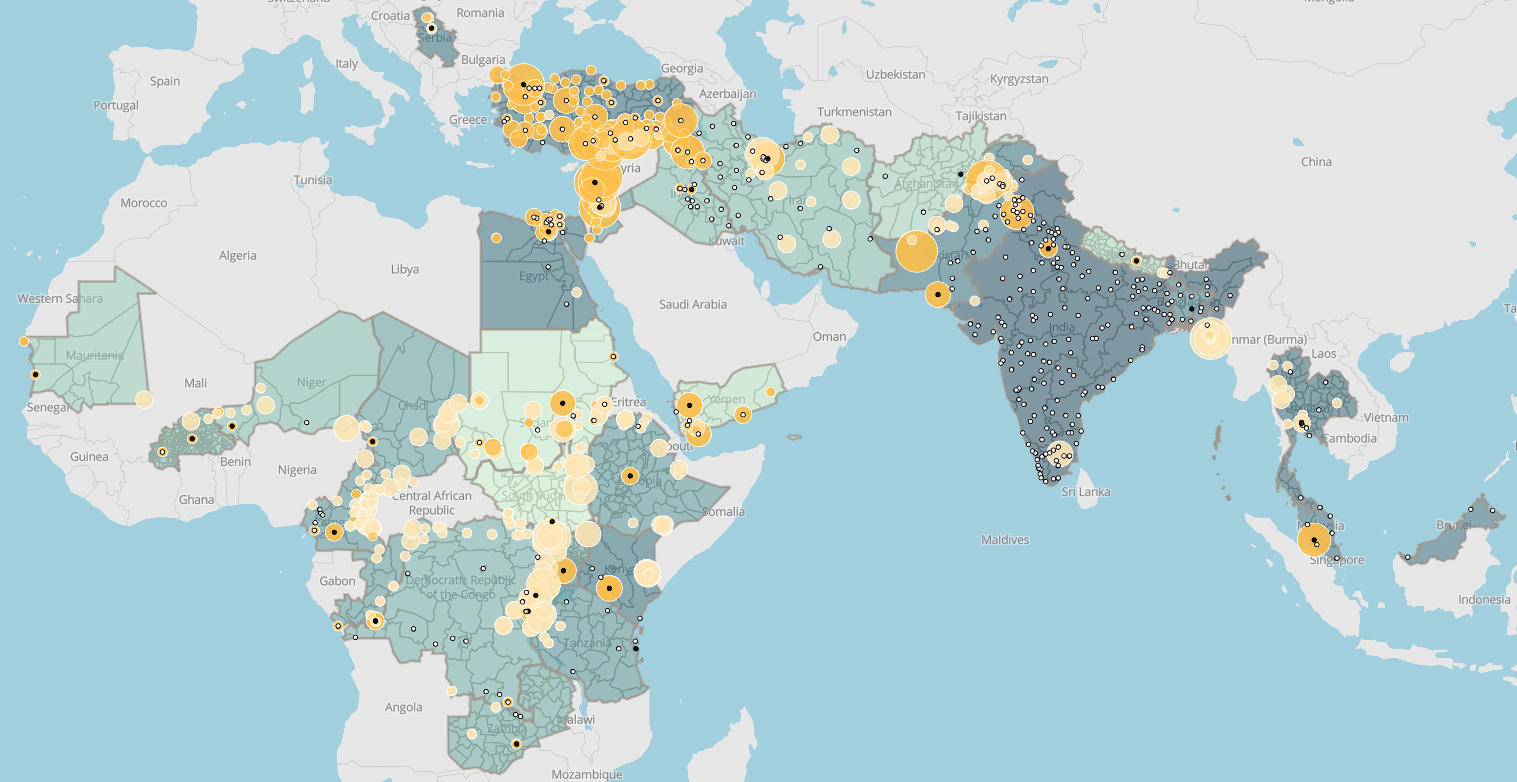
To help demonstrate where MNCs, regional and local businesses, and other actors are best positioned to expand economic opportunities for refugees, we created an interactive tool to map the locations of refugees, and analyzed the extent to which refugees overlap with major urban areas in 31 of the 37 developing countries hosting at least 25,000 refugees. When refugees are located in urban areas, where economic activity and MNCs cluster, they have a much greater likelihood of being in close proximity to potential employers.
To view the map in full-screen mode, click the button in the bottom-left. For details, click on refugee locations or hover your mouse over cities and countries. Toggle the accommodation type in the legend to view camp vs. non-camp locations. To zoom, scroll or click the buttons in the top-left. Scroll over the legend in the bottom-right to see the full legend. (Note: some of these features are not available with certain browsers or when viewing on phones and other smaller devices.)
Locations of UNHCR-recognized refugees in relation to major urban areas in 31 developing countries
The boundaries and names used on this map do not imply the expression of any opinion or acceptance by the authors.
For any questions, comments, or feedback related to the interactive map, please contact jgraham@cgdev.org.
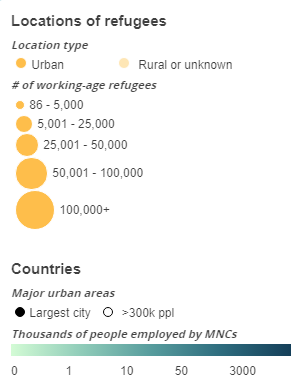
Using estimates of refugees living in countries’ most populous cities and those living in cities with over 300,000 people as lower and upper bounds for the number of refugees in or around major urban areas, we find that of the 31 countries:
- 15 to 17 have at least 7,000 working-age refugees in or around major urban areas,
- 9 to 11 have at least 25,000 working-age refugees in or around major urban areas, and
- 5 to 7 have at least 50,000 working-age refugees in or around major urban areas.
In total we estimate that there are between 915,087 and 2,186,829 working-age refugees in or around major urban areas in these countries.[5]
Countries with significant overlaps of refugees and major urban areas are located in a variety of regions, and most of the countries with substantial overlap have a significant MNC presence: the large majority have at least 1,000 people employed by MNCs with OECD home countries, and about half have more than 10,000.[6] And the number of MNCs is just the tip of the iceberg. With their deep supply chains and market leadership, MNCs can shape the local market and policy environment as well. These findings indicate there are opportunities for MNCs and regional and local businesses to engage with refugees. Our interactive map shows approximately where these opportunities are.
While our analysis shows that there is substantial overlap between refugees and urban economic opportunities, it also adds nuance to the headline that 60 percent of refugees with known locations live in urban areas.[7] For our sample of 23 countries with the best data, we estimate that 48 percent of the refugees are working age. Among them, about 62 percent are in urban areas—a proportion close to the global 60 percent figure. Among these urban working-age refugees, 62 percent are in major urban areas with at least 300,000 people, and about 24 percent of them are in the largest urban area in the host country. This means that, in addition to the fact that the majority of refugees are in urban areas, there are also substantial proportions of refugees in major and largest urban areas. For the refugees outside of these areas, there are additional opportunities for global, regional, and local businesses located in smaller urban areas to engage refugees, and those located in major urban areas can supply from refugee-owned businesses in smaller urban areas.
However, while our analysis shows that proximity is not a major barrier to expanding employment for refugees in many contexts, there are other significant obstacles in almost all these countries. In most developing countries, refugees are not legally allowed to work. Many refugees do in fact work in these countries in the informal economy, but these workers are more vulnerable to exploitation and deportation, and a lack of access to the formal economy restricts their economic opportunities. And even where refugees are allowed to work formally, de facto barriers like discrimination still affect their ability to access the labor market.[8] Other challenges include skill mismatches between refugees and employers’ needs and a lack of equal labor protections.[9] Thus, location in urban areas is just one important factor that must be considered for expanding labor market access for refugees.
To read the rest of the publication, click here.
[1] Figures at a Glance (2017). UNHCR http://www.unhcr.org/figures-at-a-glance.html.; Devictor, X. & Do, Q. (2016). How Many Years Have Refugees Been in Exile? World Bank Policy Research Working Paper, Working Paper Series, 7810. http://dx.doi.org/10.1596/1813-9450-7810.
[2] The calculation for the proportion of refugees in developing countries was made using World Bank income classifications for low- and middle-income countries and the most recent data on refugee locations from UNHCR.
UNHCR Statistical Yearbook 2016 (2017). UNHCR. http://www.unhcr.org/en-us/statistics/country/5a8ee0387/unhcr-statistical-yearbook-2016-16th-edition.html.
[3] Huang, C., Charles, S., Post, L., & Gough, K. (2018). Tackling the Realities of Protracted Displacement: Case Studies on What’s Working and Where We Can Do Better. The Center for Global Development and the International Rescue Committee. /sites/default/files/tackling-realities-protracted-displacement-case-studies-whats-working.pdf.; Devictor, X. (2017) Forcibly Displaced: Toward a Development Approach Supporting Refugees, the Internally Displaced, and Their Hosts. World Bank. https://openknowledge.worldbank.org/bitstream/handle/10986/25016/Forcibly percent20Displaced_Overview_Web.pdf?sequence=6&isAllowed=y.
[4] Huang, C. (2017). Global Business and Refugee Crises: A Framework for Sustainable Engagement. The Tent Foundation and the Center for Global Development. /sites/default/files/global-business-and-refugee-crises.pdf.
[5] Numbers of refugees are based on the 2016 UNHCR Statistical Yearbook and include all registered refugees and people in refugee-like situations. We consider working-age refugees to be between the ages of 18 and 59. Different definitions are sometimes used (such as 15 to 64), but 18 to 59 is the closest approximation to working-age that the available data allow.
UNHCR Statistical Yearbook 2016 (2017). UNHCR.
[6] Data on the number of MNCs with OECD home countries and people employed by them is based on the ‘Outward activity of multinationals by country of location’ from OECD.stat.
OECD.stat (2014). OECD. https://stats.oecd.org/.
[7] Global Trends: Forced Displacement in 2016 (2017). UNHCR. http://www.unhcr.org/en-us/statistics/unhcrstats/5943e8a34/global-trends-forced-displacement-2016.html.
[8] Zetter, R. & Ruaudel, H. (2016). Refugees’ Right to Work and Access to Labor Markets – An Assessment: Part II: Country Cases (Preliminary). Global Knowledge Partnership on Migration and Development (KNOMAD). http://www.knomad.org/sites/default/files/2017-12/KNOMAD percent20Study percent201- percent20Part percent20II- percent20Refugees percent20Right percent20to percent20Work percent20- percent20An percent20Assessment.pdf.
[9] Barbelet, V. (2017). Livelihood strategies of Central African refugees in Cameroon. Humanitarian Policy Group. https://www.odi.org/sites/odi.org.uk/files/resource-documents/11371.pdf.; Global Refugee Work Rights Report (2014). Asylum Access and the Refugee Work Rights Coalition. http://asylumaccess.org/wp-content/uploads/2014/09/FINAL_Global-Refugee-Work-Rights-Report-2014_Interactive.pdf.
Rights & Permissions
You may use and disseminate CGD’s publications under these conditions.