PovcalNet, the World Bank’s global poverty database, provides all kinds of country statistics, including mean income, the share (and number) of the population living in absolute poverty ($1.90), the poverty gap and several measures of income inequality, such as the Gini coefficient. But one thing it doesn’t provide is median income or consumption. The median is a better measure of “typical” well-being than the mean, which is always skewed to the right.
We’ve been waiting for the World Bank to add these medians to its PovcalNet database, but we got impatient and did it ourselves. By manually running a few hundred queries in PovcalNet, we now have (and can share with you) the latest median income/consumption data for 144 countries (using 2011 PPPs — more on our methods below).
Download: country-median-data-2011-PPP-Diofasi-Birdsall.xls
By making this data public, we hope to encourage more development professionals to use the median in evaluating individuals’ material well-being in developing (and developed) countries and progress toward broad-based economic growth and shared prosperity. We also hope that wider use of the median will provide an incentive for the World Bank to publish the data in an easily accessible format along with the full distribution, in line with its open data policy.
Why the median?
Average or mean-based measures of income, such as GDP per capita, will always be higher than the median — the value at the midpoint — of that distribution, which is inevitably skewed to the right. So medians convey far better the material well-being of the typical individual in a country and have other advantages including simplicity and durability. The simplicity helps explain why the stagnation of the median wage is so often cited in the US press in the context of middle-class decline as the benefits of growth go to the top. Real median household income has been about $53,000 a year or $48 a day per person for a family of three. That puts median income per person in the US at only just about one-third of average income measured as GNI per capita.
A better example for the development community: the median reflects how much the person at the 50th percentile of the income distribution earns (or spends), giving us a better picture of the well-being of a “typical” individual in a given country. Take Nigeria and Tanzania: in 2010, Nigeria’s GDP per capita (at PPP) was $5,123; Tanzania’s stood at only $2,111. This suggests that Nigerians were more than twice as well off as Tanzanians. Yet, if we compare consumption medians, a different picture emerges: a Nigerian at the middle of the income distribution lived on $1.80 a day, while his or her Tanzanian counterpart had 20 cents more to spend, at $2 a day.
That difference is illustrated in the graph below, with countries plotted left to right according to their GDP and vertically according to their median income or consumption. The highlighted pairs, such as Nigeria and Tanzania, have very different GDPs per capita while sharing similar levels of typical well-being as measured by median income or consumption.
Using PovcalNet to extract the medians: data and very brief methodology
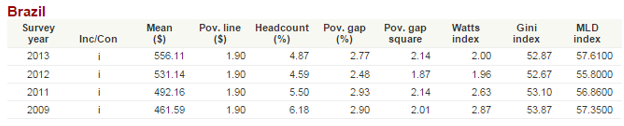
Despite the illustrative power of the median, the development literature still relies largely on GDP (per capita) or sometimes on the marginally more representative GNI (per capita). For the last five years, the data needed to calculate country medians has been available via the World Bank’s PovcalNet database. PovcalNet provides information about poverty and inequality across the globe based on over 800 representative household surveys and 1.2 million households in over 140 economies. It is a treasure trove for scholars, students, and development professionals, but it fails to live up to its full potential in its current format. In one query, one can view average monthly income, the share of the population below a user-determined poverty line, the poverty gap, the Gini index, and other, more obscure measures of poverty and inequality (see the screenshot on Brazil’s data below). But there is no easy way for users to check the median income or consumption for a country or to access a country’s full income distribution. There is also no way to download query results in an easily editable format like a csv or xls file.
A year and a half ago, our colleagues Justin Sandefur and Sarah Dykstra ran 23 million queries through PovcalNet over the course of nine weeks and made the resulting global poverty and income distribution data (using 2005 PPPs) available to the public. We didn’t attempt to repeat their herculean efforts, but we did create a dataset of median income/consumption for all countries available using the recently updated 2011 PPPs. Our median data was obtained in its entirety from the World Bank’s PovcalNet database. We use the latest survey year available and list whether the median is based on consumption or income data. We also note — as PovcalNet does — whether the data is grouped (C or I) or whether it represents unit-record data (c or i). For China, India, and Indonesia values for rural and urban areas are listed separately. The data were collected by manually entering a guesstimate for the given country’s median as the “poverty line,” and revising the guesstimate until the associated headcount was 50 percent. Deviations of up to 1.5 percent in the headcount associated with the median are possible.
Disclaimer
CGD blog posts reflect the views of the authors, drawing on prior research and experience in their areas of expertise. CGD is a nonpartisan, independent organization and does not take institutional positions.