In Durban, South Africa, thousands are currently gathered at the International AIDS Conference to share, learn, teach, and advocate for ending the AIDS epidemic by 2030. This global goal, advanced in 2014 by UNAIDS, is now supported by all major players in the fight against HIV/AIDS.
According to UNAIDS, a necessary condition to accomplish this goal is to expand antiretroviral treatment (ART) coverage of those infected with HIV from its current level of around 40 percent to 81 percent by 2020. This coverage could be achieved if 90 percent of people infected with HIV know their status, and 90 percent of those individuals then start treatment. As I’ve discussed before, these targets set in UNAIDS’ “90-90-90” campaign are ambitious, especially given that the need for treatment continues to climb as donor commitments for AIDS decline.
New research by the Institute for Health Metrics and Evaluation’s Global Burden of Disease group in The Lancet HIV this week brings new information to this conversation. The study estimates AIDS treatment coverage, new HIV infections, and AIDS deaths in every country. This is the first time in decades that any independent party has attempted to compete with UNAIDS’ own estimates for these same indicators. (Competing estimates were compared in an annex of Confronting AIDS, 1997.) All of us interested in the progress of the epidemic should be fascinated to see how well the two sets of estimates agree—and where they differ. Even more important is whether the prospects for ending the AIDS epidemic appear different from the two perspectives.
The short answer is that IHME’s estimates suggest a smaller role for treatment in reducing new infections and thus a greater need to improve the quality of all prevention interventions.
Let’s take a closer look…
For countries in sub-Saharan Africa, Figure 1 compares the most recent UNAIDS’ estimates of new infections, deaths and treatment coverage (panel A) with those just released by IHME (panel B). In each panel, a country’s infection rate is represented by a green circle and its death rate by a red “x”. These rates are calculated per 100 people living with HIV and plotted against that country’s ART coverage rate (horizontal axis of both panels).
Figure 1: Comparison of UNAIDS’ and IHME’s estimated new HIV infections and annual AIDS deaths in Africa, as associated with treatment coverage
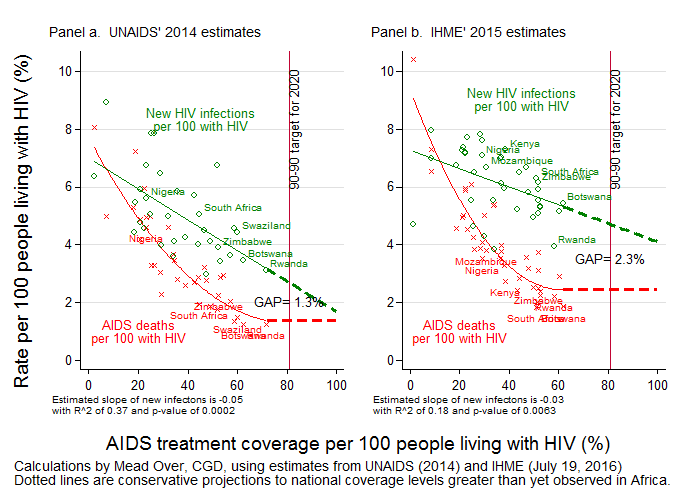
As expected, the death rates (red x’s) in both panels show a strong negative association between –treatment coverage and mortality, confirming that expanding treatment prevents deaths. Although the association starts out strongly negative at low coverage levels, it flattens as coverage approaches 60 percent, which suggests diminishing benefits of treatment coverage on mortality rates. This could be because higher coverage rates recruit people who have less motivation to adhere or because lowered HIV mortality rates begin to compete with mortality from other causes. Thus a conservative projection to UNAIDS’ 81 percent coverage target would be little further reduction in mortality, as illustrated by the horizontal dashed red lines in the two panels.
What about the association of treatment coverage with new infections? It is well-established that assiduous adherence to ART can suppress HIV to undetectable levels, thereby preventing transmission of the virus from an infected person to an uninfected sex partner. (See discussion of HPTN 052 here.) However, whether a country’s AIDS treatment expansion would cause a reduction in new infections at the population level is harder to establish. The US President’s Emergency Plan for AIDS Response (PEPFAR) and other donors are funding three expensive long-running trials to test this hypothesis. In the meantime, if we are to believe the negative slopes of the regression lines fitted to the infection rates (green lines) in Figure 1, the answer is affirmative. In other words, despite the fact that many AIDS patients who are on treatment do not have a suppressed viral load—and can therefore still infect others—and that some people on treatment might engage in risky sexual behaviors thinking they cannot pass on the virus, the negative association between treatment and new infections suggests that, on average, countries with higher treatment coverage have indeed experienced lower infection rates at the population level. Furthermore, the data shows no sign of diminishing prevention benefits at higher coverage levels. Therefore, a conservative projection to the 81 percent coverage target is that countries will push their rates of new infection lower than have ever been observed in Africa (as illustrated by the dashed green lines).
But will that be enough? To put an end to the AIDS epidemic, the number of new infections must be pushed even lower than the AIDS mortality rate, a milestone projected by UNAIDS that I have dubbed the “AIDS transition” and PEPFAR has called “epidemic control”. The figure shows that simply increasing treatment coverage and waiting for the projected infection reductions will still leave a substantial gap between new infections and AIDS-related deaths. At the target coverage of 81 percent, UNAIDS estimates (panel A) suggest a gap between the two rates of 1.3 percent, meaning the number of people living with AIDS would grow at 1.3 percent per year. According to IHME (panel B), the gap would be nearly twice as large, with the number living with AIDS growing at 2.3 percent per year.
IHME’s estimates are more pessimistic than UNAIDS’ in other ways. According to IHME, there are slightly more AIDS deaths and a great many more new infections in these African countries. Globally, IHME estimates a total of 2.5 million new infections, nearly 20 percent more than the total new infections estimated by UNAIDS. Moreover, while the two institutions agree on the beneficial association of treatment coverage with mortality (similarly sloped red lines), IHME is less optimistic than UNAIDS regarding the beneficial association between treatment coverage and new infections (steeper green line in panel A than in panel B).
Of course, it’s always dangerous to project the future from mere associations. And AIDS advocates have every reason to be dissatisfied with projecting these historical associations to the future with higher coverage rates. One reasons for greater optimism is that, if expanded treatment coverage were associated with 90 percent viral suppression, as specified by the third “90” in UNAIDS’ “90-90-90”, both mortality and new infections would be reduced so that the dashed segments of the red and green trend lines in the figures would slant down towards the abscissa. Another reason is that improved coverage and effectiveness of non-treatment interventions, such as couple testing and, for particularly vulnerable, disempowered groups, PrEP, can reduce new infections at any level of treatment coverage.
To achieve the AIDS transition, we should heed UNAIDS latest call to put a quarter of HIV/AIDS spending on HIV prevention, so that the gap between new infections and mortality is closed and the HIV/AIDS burden finally begins to shrink.
Note on the methods: The lines fitted to the scatter plots in Figure 1 are constructed from the regressions presented below. While the quadratic term is statistically significant in both equations with deaths as the dependent variable, equations (1) and (4), that term is not statistically significant in the equations explaining new infections. Therefore, in the figure I used equations (3) and (6) to summarize the associations between new infections and ART coverage.
Table 1: Estimated regressions used to trace the trend lines in Figure 1 Panel (a) uses columns (1) and (3). Panel (b) uses columns (4) and (6).
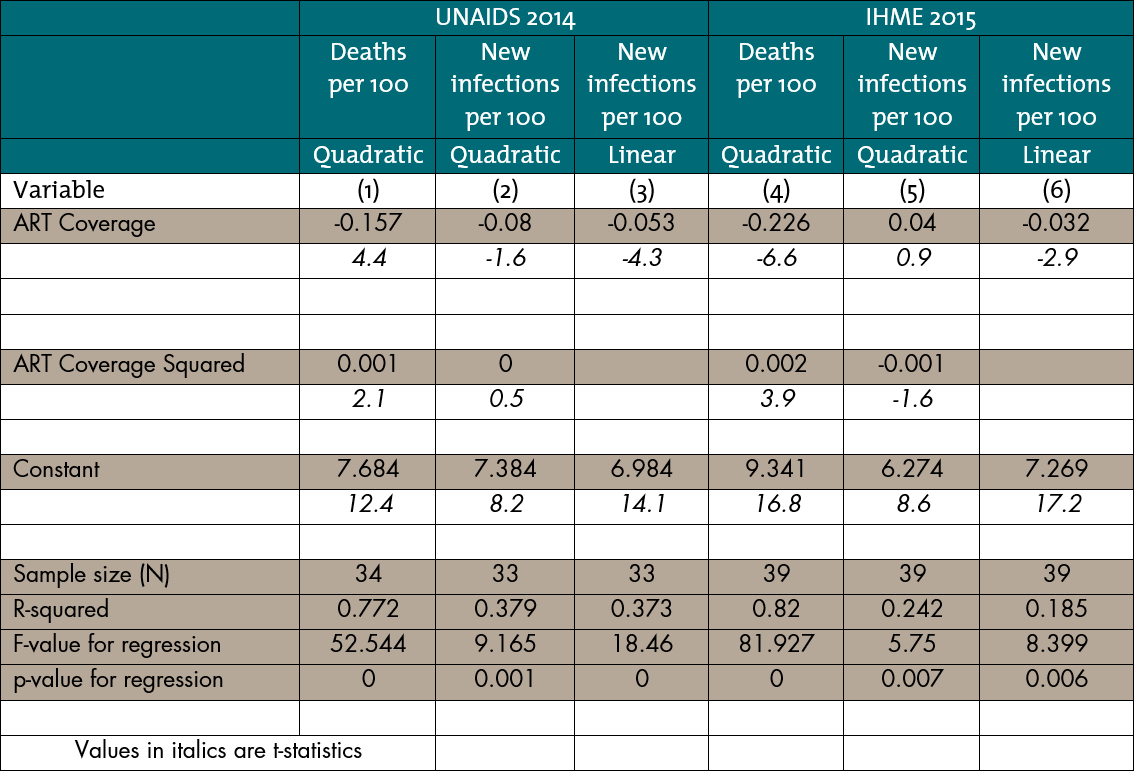
The observations used to estimate the four equations include all the countries in the respective data bases except the smallest ones, where the UNAIDS and IHME estimates might be less reliable. Cape Verde and Mauritius are omitted from both the UNAIDS and the IHME samples. From the IHME sample are also omitted Gambia, Mauritania, Sao Tome and Principe, Comoros, Djibouti, and Equatorial Guinea.
Disclaimer
CGD blog posts reflect the views of the authors, drawing on prior research and experience in their areas of expertise. CGD is a nonpartisan, independent organization and does not take institutional positions.