As the Center for Global Development’s inaugural Evidence in Policy Fellow, I just finished an extended engagement to help increase data and evidence use in the State Department’s Office of Foreign Assistance. While at State, I spent much of my time leading and participating in the work of the interagency Global Fragility Act (GFA) Monitoring, Evaluation, and Learning (MEL) group. Based on that experience, I will publish two blog posts analyzing GFA implementation.
The US Congress passed the GFA in late 2019, calling for a more proactive, whole-of-government approach to conflict prevention that would be piloted in at least five countries. Although the law called for the administration to select the priority contexts and draft 10-year country implementation plans within one year, the priority countries were only announced in April 2022: Haiti, Libya, Mozambique, Papua New Guinea, and one region, Coastal West Africa, which includes Benin, Cote d’Ivoire, Ghana, Guinea, and Togo. In March 2023, the administration delivered the 10-year country plans to Congress, making them public in March 2024.
Congress began appropriating foreign assistance funding in FY 2021—before the announcement of priority countries. Given that Congress has now appropriated GFA foreign assistance for four fiscal years—FY 2021, 2022, 2023, and 2024—it is useful to take stock of some high-level trends. In this post, I analyze US foreign assistance and conflict and violence trends in the priority countries and region, both before and after GFA initiation.
This analysis suggests three interesting conclusions that warrant deeper scrutiny. First, only Papua New Guinea has received steadily more in foreign assistance disbursements since FY 2020. Second, only Papua New Guinea and Libya have shifted the sectoral composition of aid flows towards the sectors more likely to be associated with peacebuilding-specific objectives—the Democracy, Human Rights, and Governance and Peace and Security sectors. Third, it's noteworthy that Haiti and Papua New Guinea are experiencing a clear trend towards increased conflict activity and fatalities.
Between FY 2016 and FY 2020, the US invested about $8 billion in the nine priority countries
In the five years before GFA foreign assistance disbursements began, the US invested about $8 billion across the nine priority countries, about 3 percent of total foreign assistance during this period.
As one would predict, the amount allocated to Coastal West Africa, which comprises five countries, was the highest ($3.2 billion), but by a relatively small margin.[1] The total amount to Papua New Guinea was the lowest ($57 million).
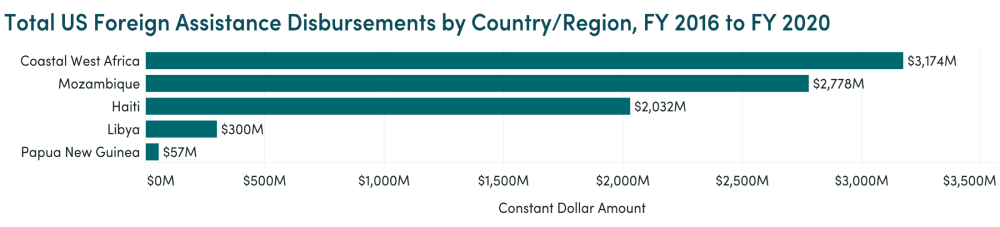
Data Source: Foreignassistance.gov; January 2024 download
The significance of GFA funding varies by priority country
The legislation established two funds for GFA implementation—the Prevention and Stabilization Fund (PSF) and the Complex Crisis Fund (CCF). Although the law authorized PSF funding levels of $200 million per year between FY 2020 to FY 2024, the appropriated funding levels have been lower. In FY 2021, $100 million was appropriated; in FY 2022, $125 million; in FY 2023, $135 million; and in FY 2024, $135 million. The authorization for the CCF was $30 million per year between FY 2020 and FY 2024, but in the past three years Congress has appropriated higher amounts. In FY 2021, Congress appropriated $30 million to the CCF; in FY 2022, $60 million; in FY 2023, $60 million; and in FY 2024, $55 million. However, the CCF funding, which was appropriated to USAID, is not necessarily going to the GFA priority countries. The PSF funds are divided among the five pilot contexts, as well as any other GFA implementation priorities, such as data acquisition and strategic MEL.
The relative significance of GFA funding for each priority country varies depending on the base amount. Using FY 2020 as a base year, the disbursements by country align with the aggregated FY 2016 to FY 2020 analysis, with Coastal West Africa receiving the highest amount, Mozambique as a close second, and Papua New Guinea the lowest.
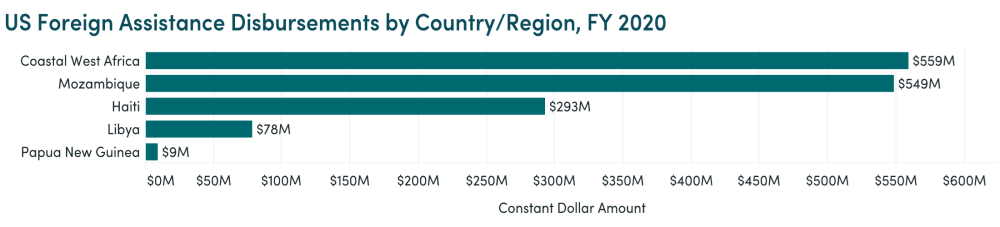
Data Source: Foreignassistance.gov; January 2024 download
With these base amounts, GFA funding will constitute a more significant share of total funding for Papua New Guinea or even Libya than the other countries and region.
Only Papua New Guinea shows a clear trend of disbursement increases since FY 2020
Although the publicly available data makes it difficult to assess the portion of disbursements that are GFA-specific, an analysis of disbursement trends by country from FY 2018 to FY 2022 still yields meaningful insights—though it’s worth noting that there is often a considerable lag between when funding is appropriated, when it is obligated, and when it is eventually disbursed. In other words, FY 2021 disbursement data may not reflect the influence of GFA.
First, Papua New Guinea is the only priority country that shows a clear trend of yearly disbursement increases after GFA appropriations began, namely in FY 2021 and FY 2022. This is somewhat surprising, given that its FY 2020 base funding was the lowest of the five priority countries, creating a risk that it lacked the capacity to absorb the sizeable funding increase. A Country Representative Office—not even a full mission—was only established in Papua New Guinea in 2023. The other countries have not yet experienced a steady uptick in disbursements.
US Foreign Assistance Disbursements by Country/Region and Sector, FY 2018 to FY 2022
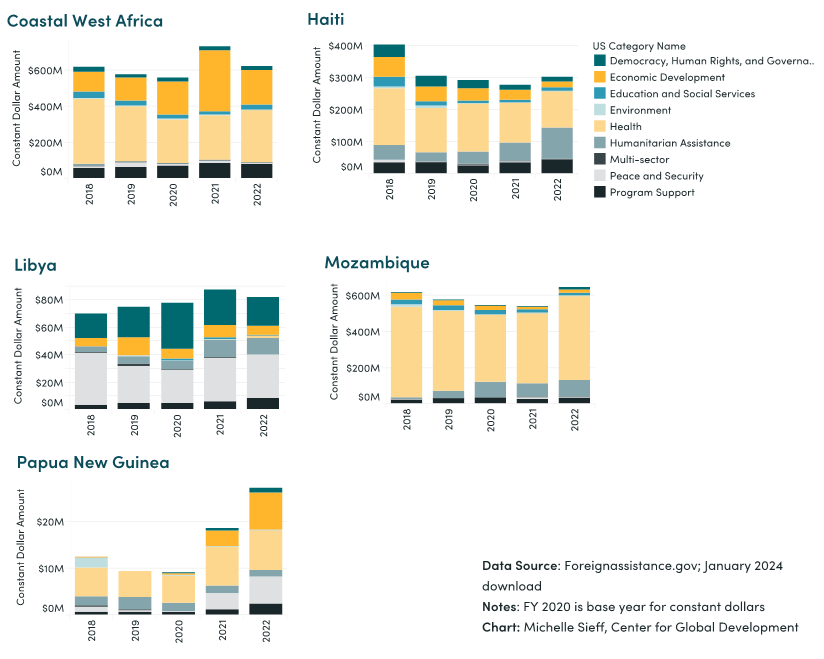
Historical patterns of sectoral composition persist
Second, historical patterns in the sectoral composition of disbursements seem to persist over time. We are not yet seeing significant changes in the share of funding allocated to the sectors that the evidence base suggests are most relevant to peacebuilding—Democracy, Human Rights, and Governance and the Peace and Security sectors. For example, in Mozambique, the health (yellow) and humanitarian assistance (blue-grey) constitute the overwhelming majority of its disbursements over the five-year period, and that really hasn’t changed in FY 2021 or FY 2022. This is despite the fact that the US 10-year plan for Mozambique does not indicate that improving health outcomes is a conflict stabilization strategy.
In contrast, both Papua New Guinea and Libya have historically allocated a more significant share of funding to either or both peace and security (light grey) and democracy, rights, and governance (teal)—and those historical patterns persist.
In fact, since GFA funding began, Papua New Guinea has shifted its portfolio towards higher proportions in both the Peace and Security and Democracy, Human Rights, and Governance sectors, while Libya has increased the share allocated to Peace and Security but decreased the share to Democracy, Human Rights, and Governance.
Why is this important? Because the GFA called for the US to reform the bureaucracy so that total foreign assistance to priority countries—not just GFA-specific assistance—would be more aligned with conflict prevention and stabilization goals. If the data suggests that there is a lot of “stickiness” in the sectoral composition of disbursements, and funding is not shifting towards peacebuilding goals, then it is critical to diagnose and address the causes.
One frequently invoked theory is that congressional spending directives constrain flexibility and hence result in sub-optimal allocation strategies, and as this Center for Strategic and International Studies report concludes, although country earmarks have decreased, sectoral earmarks have increased over time. In Mozambique, Congress has tagged 90 percent of the budget for health, which certainly restricts flexibility. Earmarks may be the salient factor in Coastal West Africa and Haiti, but the main point is that it is important to diagnose the causes and address them.
Conflict trends key takeaways: Haiti and Papua New Guinea deteriorating
The country-level conflict and violence data is more difficult to interpret—and should be contextualized with a rich qualitative analysis—but one takeaway seems clear: Both Haiti and Papua New Guinea show a clear and steady uptick in both conflict events and fatalities since 2021.[2]
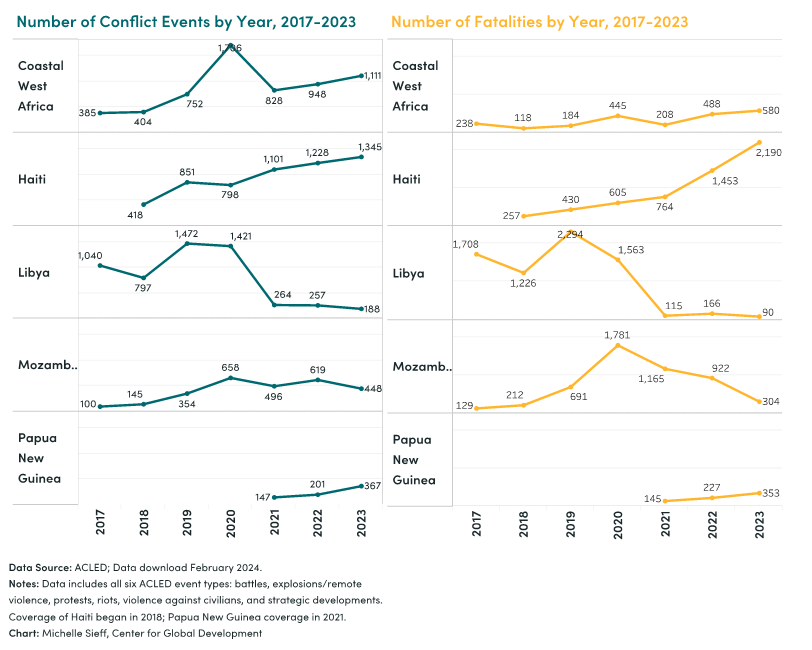
This trend has continued in 2024. Haiti is embroiled in a new wave of gang violence, and in February Papua New Guinea experienced one of its most violent ethnic clashes in years in the remote highlands.
The other countries present a more varied and volatile picture. The data on Coastal West Africa shows a sharp decrease in conflict events from 2020 to 2021, but since 2021, a steady increase in both events and fatalities. Libya also shows a sharp decrease in events and fatalities between 2020 and 2021, and this trend has basically continued, except for a small increase in fatalities between 2021 and 2022. Mozambique appears slightly more volatile, but the general pattern since 2020 is also a downward trend in both conflict events and fatalities. But volatility is the key word: According to ACLED data, Mozambique had already experienced 137 conflict events in January and February 2024—about 25 percent of its 2023 total—primarily driven by a new wave of jihadist attacks by armed groups linked to the Islamic State in the northern province of Cabo Delgado.
This time series analysis of conflict trends is not causal; we definitely cannot attribute changes in the conflict trends to the US government or GFA. But if conflict trends deteriorate in specific countries, this disconfirming evidence of the theory of change should send a signal to policymakers to re-examine the coherence of the overall policy and strategy. As scholars Lise Howard and Susanna Campbell have argued, the most important condition for peacebuilding success is field-based organizational learning and adaptation in response to the effects of policy interventions on the context. In the real world, policymakers managing complex conflicts may need to make informed judgments about these effects and will not have time to conduct rigorous evaluations. To its credit, the GFA underscored the importance of ongoing learning and course corrections.
So what, now what?
Although this analysis of US foreign assistance and conflict trends surfaces useful insights, a wider-angle lens is necessary. The GFA was never intended as a foreign assistance-focused policy.
The GFA’s intent was to strategically integrate multiple foreign policy tools beyond foreign assistance, but as Allison Minor argues, the current country plans do little to prioritize other tools, such as diplomatic engagement or sanctions. One could imagine a different approach that deployed coercive diplomacy—a term coined by the political scientist Alexander George—to modify the expected payoffs and incentives of target actors, and hence alter the outcomes of foreign assistance in the priority countries. As conflict levels reach near historic highs, it may be time for some course corrections.
Thanks to Erin Collinson for comments on a previous draft.
[1] I analyze Coastal West Africa as an aggregated region, rather than as individual countries, recognizing that there are tradeoffs to the different analytic approaches.
[2]For conflict and violence data, I use the Armed Conflict Location and Event Data Project, because it is an excellent data source and the US government is funding it to improve data quality in the GFA countries through the multi-donor Complex Risk Analytics Fund (CRAF’d). ACLED’s coverage of Haiti only began in 2018, and Papua New Guinea in 2021. However, any dataset incorporates biases and the choice of ACLED versus a different conflict event dataset (such as the Uppsala Conflict Data Program) has policymaking ramifications, as this article authored by the ACLED project directors explains.
Disclaimer
CGD blog posts reflect the views of the authors, drawing on prior research and experience in their areas of expertise. CGD is a nonpartisan, independent organization and does not take institutional positions.
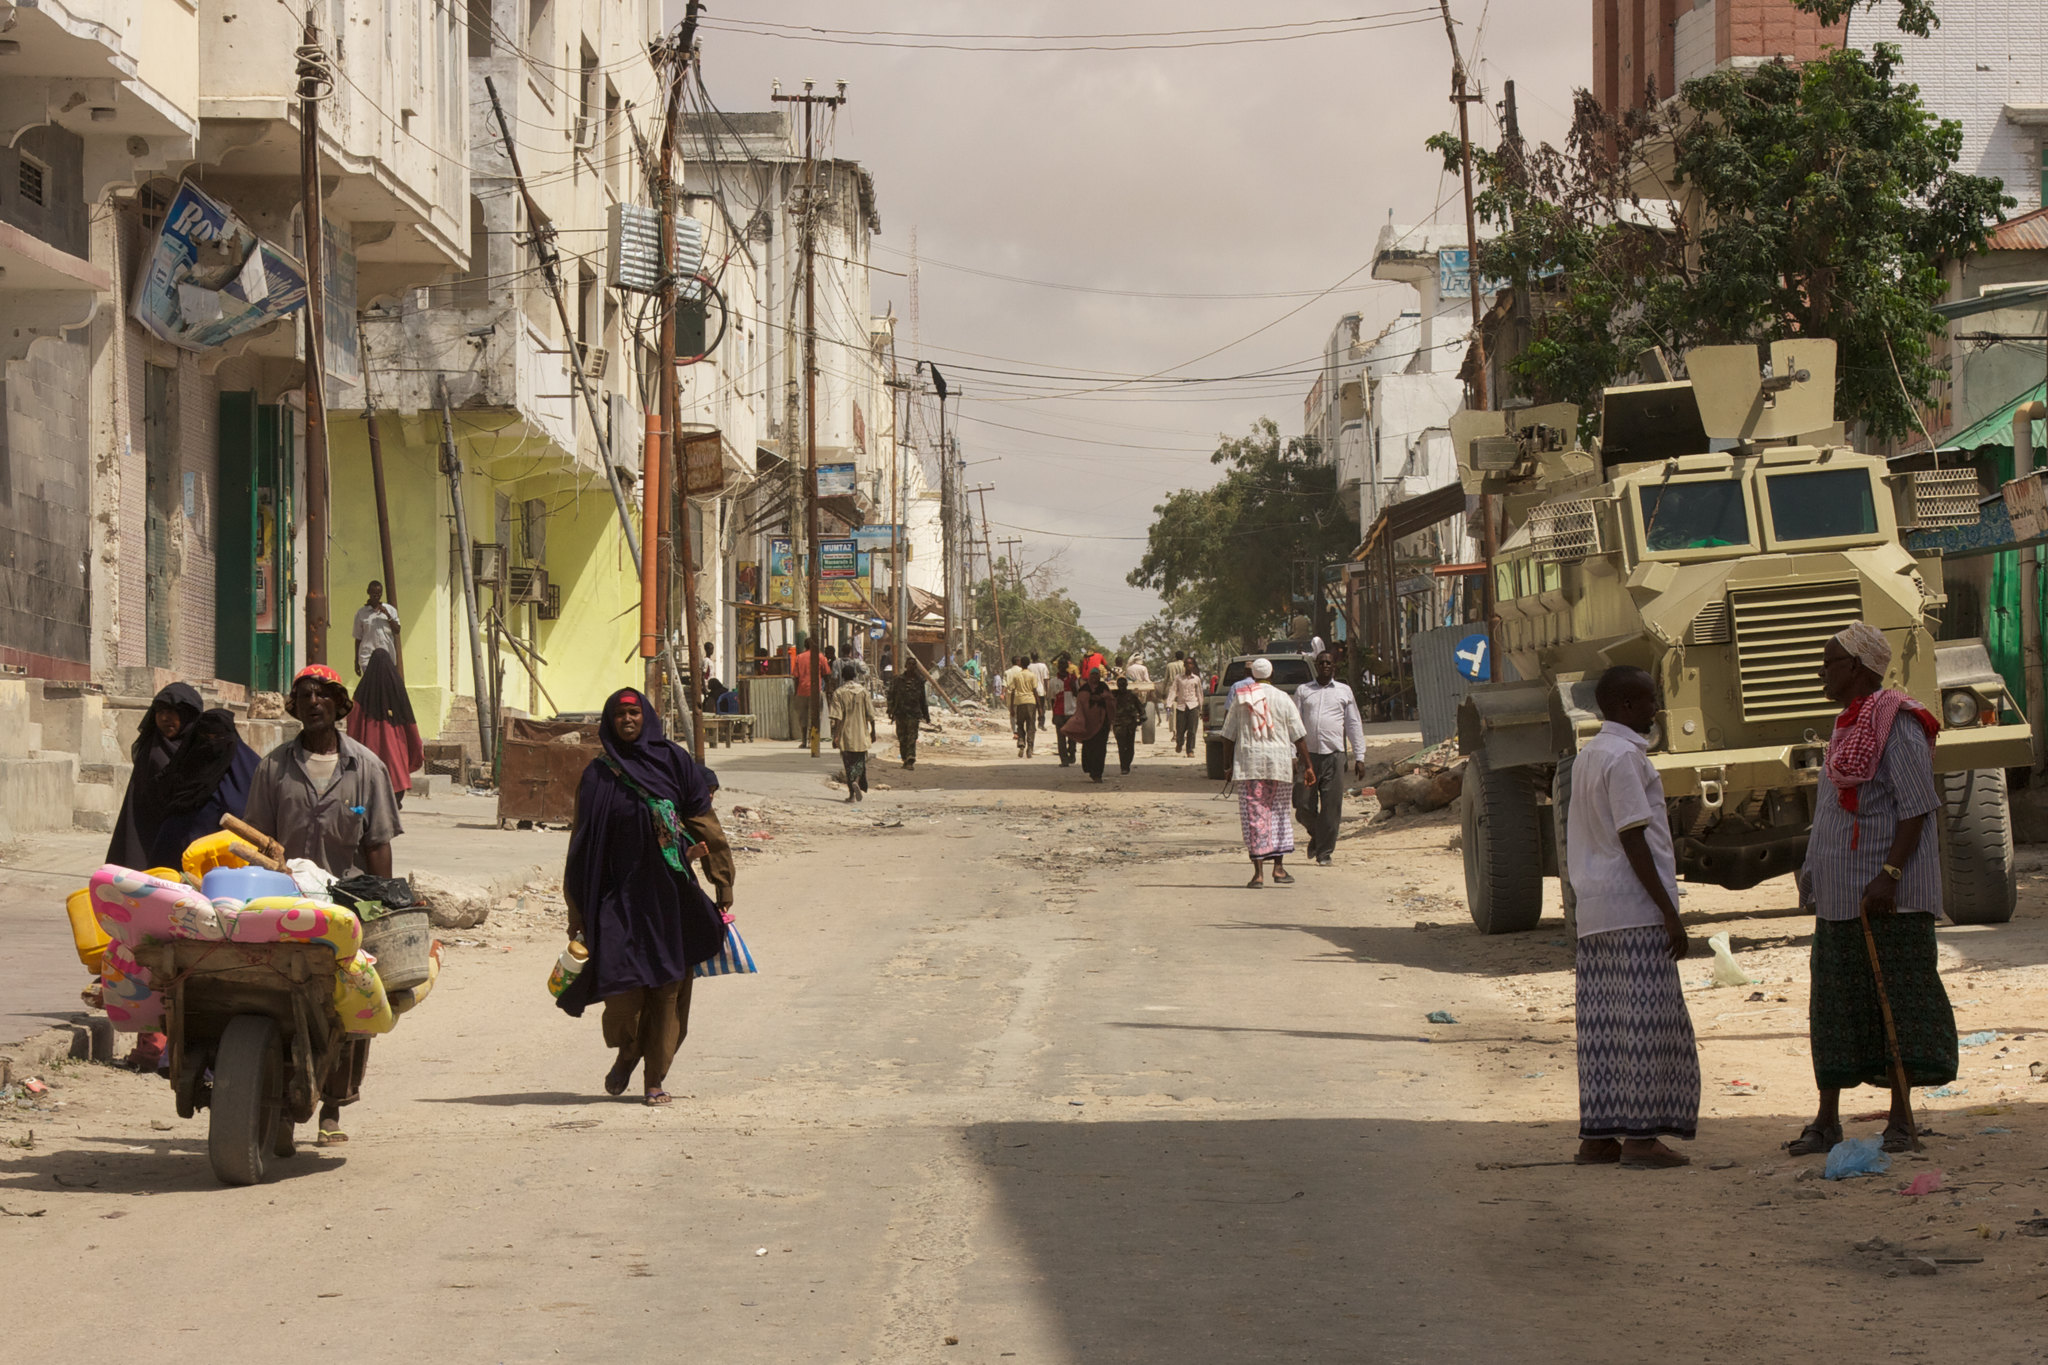
Image credit for social media/web: Matt Crook / Flickr