The Social Progress Index is an effort of the Social Progress Imperative to create a new and better way to compare the human and social development performance of countries. High on their agenda is to not use GDP per capita or other measures of national development, but rather focus on direct measures of human well-being. And it turns out to be a useful measure of the importance of national development. Let me explain.
The Social Progress Index (SPI) has three components:
1. basic human needs,
2. foundations of wellbeing, and
3. opportunity.
Each of these three components are built of four sub-indicators which are each themselves built up from raw data. For instance, 1) basic human needs has four sub-components:
1.1 nutrition and basic medical care,
1.2 water and sanitation,
1.3 shelter,
1.4 personal safety.
The sub-component 1.2 water and sanitation is based on data on:
1.2.a access to piped water,
1.2.b rural access to improved water source, and
1.2.c access to improved sanitation.
In apparent contrast to the SPI approach, in earlier papers with Michael Woolcock and Matt Andrews, I have argued one definition of national development is a four-fold transformation of nation-states towards (1) a more productive economy, (2) a more responsive polity, (3) a more capable administration, and (4) more equality of treatment of all citizens. With Charles Kenny I argued that high levels of national development were highly correlated with nearly every proposed normative measure of human development and hence drive towards greater national development was typically a powerful source of gains in human development. This new SPI is a fresh chance to assess how strong the connection is between national development and direct measures of human well-being.
Turns out, this new Social Progress Index (SPI) is almost perfectly correlated with national development. If one predicts the Social Progress Index using just three measures: (ln) GDP per capita (productive economy), the POLITY index of autocracy/democracy (responsive polity) and World Governance Indicator of Government Effectiveness (capable administration) the correlation across 128 countries of the actual values of SPI with the predicted values is .961 (an R-Squared of .924). A correlation of .96 in cross-section data is amazingly, astoundingly high. Most people would feel that two measures correlated at .96 are measuring the same thing, not even highly correlated measures of different things. (In fact, often two measures of the same thing—like “years of schooling of the adult population”—don’t have cross-national correlations as high as.96 due to pure measurement error.)
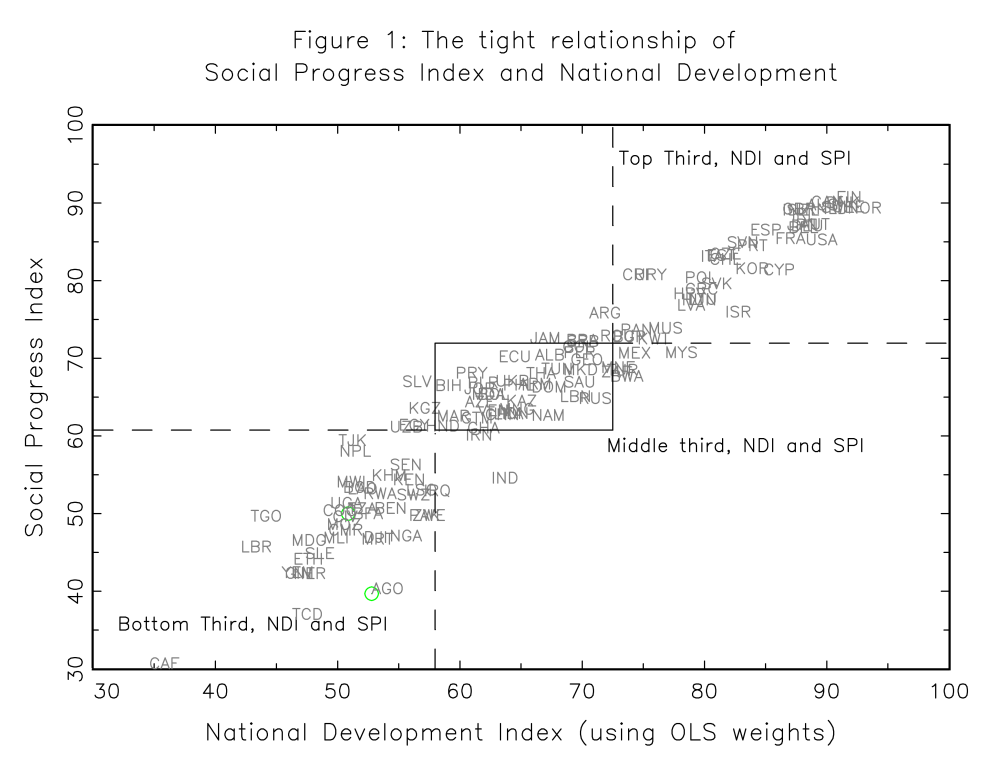
Figure 1 shows the scatter-plot of the actual values of the Social Progress Index and the predicted values (the predicted values are the National Development Index which best predicts SPI).
The boxes are drawn in the graph to emphasize the white space. White space in this graph means something—it is the combination of country experiences in social progress-national development that just don’t happen. The northwest section is white space because no country in the bottom third of national development (the west on NDI) is anywhere near the top third of social progress (north on SPI). Similarly the southeast section is white space because there is no country in the top third of national development (east on NDI) anywhere near the bottom third of social progress (south on SPI). And pretty much all the countries in the middle third by national development are at or near the middle third on social progress.
One can imagine two “pure” development strategies. ‘Due North’ means doing as well as possible on Social Progress while holding national development fixed. ‘Due East’ means going after national development while acquiring only the Social Progress gains expected from the north-east sloping relationship.
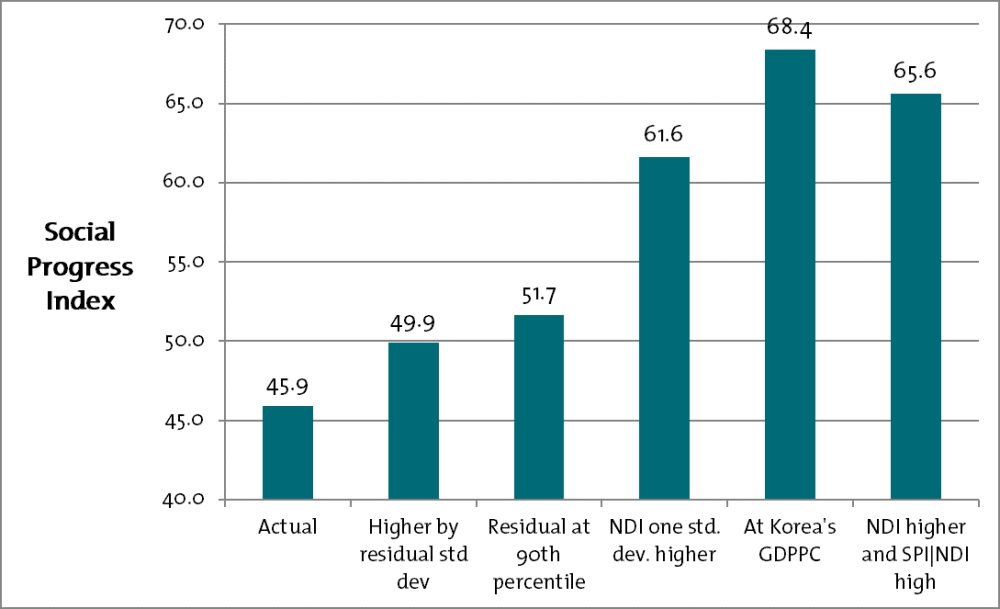
It is obvious that for countries with low national development (the bottom third) the Due North strategy of focusing on increasing Social Progress while holding national development fixed has sharply limited prospects. A typical country in the bottom third, like Mozambique, has an actual and predicted SPI of about 46. The regression residuals have a standard error of about 4 so that if Madagascar had SPI performance one standard error better than predicted for its NDI its SPI would be 50. That would move it to ahead of Pakistan and Zimbabwe (at 49) to about the level of Tanzania or Uganda. Alternatively, the 90th percentile of the residuals is 5.75. So if Madagascar were among the 10 percent best SPI performers for its level of NDI it would be at 51.75, reaching Rwanda, but would not achieve the Social Progress of Laos or Bangladesh. Even if Madagascar were the best performer of SPI for its level of national development it would still be in the world’s bottom third on Social Progress.
In contrast, the predicted gains from national development progress are both powerful and unlimited on the upside. So, for instance, if Madagascar improved its GDP per capita, government effectiveness and polity scores by one standard deviation each, its predicted Social Progress would rise to 61.6—ahead of Egypt (60.74) and approaching Morocco (61.9) or China (62.1). And if Madagascar had experienced the growth performance of Korea and had Korea’s GDP per capita that alone would raise the predicted SPI to 68.4—ahead of Thailand or Turkey.
Of course, there is no reason why a country could not have both national development progress and improve its SPI relative to NDI as the same time. For instance, moving ahead in NDI by one standard deviation and having SPI higher for NDI, Madagascar reaches 65.6.
Technical Points: One Big and Two Small
The big point is that correlation is not causation. I am not using statistical procedures (either OLS or other) to resolve whether NDI causes SPI or vice versa. Causality is resolved by theory. The basic theory of the consumer tells us an expansion in consumption possibilities (the budget set) causes higher consumption of all normal goods (budget expansion paths are upward sloping). Higher consumption does not, per se, cause higher income or expand the budget set. Many of the SPI items are consumption items (e.g. piped water) and no one has a causal theory that suggests these are causes (much less the predominant causes) of higher output per worker, GDP or better government. Hence there is a well worked out and empirically validated causal theory of how NDI causes SPI but not (for many/most items in SPI) vice versa. (That said, some SPI items could be argued and we’ll argue that out another day).
Now to the small points. First, the fit is amazingly good given how much measurement error people think there is in measuring concepts like “social progress” or “national development.” Suppose the true relationship was that national development and social progress were perfectly correlated and hence national development predicted social progress exactly, but that each was a concept measured relative to the true concept with a small amount of measurement error—a noise to noise plus signal of 4 percent. Then the observed R-Square would be .924 just from measurement error alone. Second, I did all this empirical work in a few hours and hence have had no time to data mine or functional form mine or goodness of fit mine in any way (for instance, the observation for El Salvador (SLV) on GDPPC just looks way too low to me and hence it looks like a good SPI performer for is level of national development, and if I am right then fixing this would raise the R2; similarly India appears to underperform in part because the WGI measure thinks India has a more effective government than Indonesia, Vietnam or Argentina (which I have my doubts about), and a lower number for India would improve the R2. I just put natural log of PWT8.0 GDPPC (for which the latest data is 2011), the WDI number for Government Effectiveness (and maybe some other “state capability” indicator would give better fit), and the raw POLITY score. With any effort I could crank the R-Squared (a bit) higher but that this is just the “slap in the standard data in the standard way and see what happens” goodness of fit which makes .96 even more amazing.
One of the big debates about efforts like the MDGs or SDGs that drive donor agendas is how much progress can be achieved “programmatically”—by the application of specific projects, programs or policies at existing levels of national development—and how much of progress on human development will require national development (in its multiple dimensions of the four-fold transformation). The very tight association of national development and measures of human development or social progress is an important fact that should inform this debate.
Disclaimer
CGD blog posts reflect the views of the authors, drawing on prior research and experience in their areas of expertise. CGD is a nonpartisan, independent organization and does not take institutional positions.