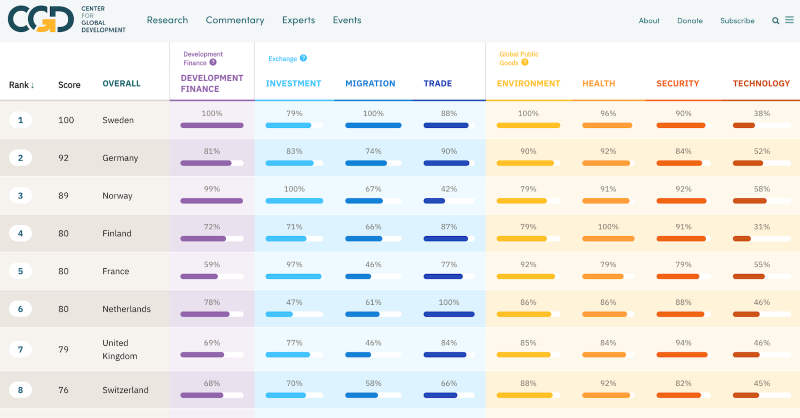
On September 5, we launched the results of the 2017 Commitment to Development Index (CDI), which scores 27 countries on how development-friendly their policies are. This year, we include two new indicators assessing how rich-country “tariffs” (taxes on imports) and “subsidies” (payments to domestic producers) inhibit development. But which is more damaging, and therefore deserves a greater weight in the Index?
Using the approach embedded in previous CDI calculations, we calculate that tariffs may be over three times as damaging as agricultural subsidies in inhibiting developing country trade. Below, we look at how tariffs and subsidy inhibit development, and assess their respective impact.
How do rich-county trade and agriculture policy matter to development?
Trade is just one of seven components in the CDI, but it’s a crucial one: no country has prospered without strong trade relationships. However, rich countries often protect their markets with tariffs on imports, or support their industries with subsidies—in either case, it is harder for developing country producers to sell to those markets. Alongside measures on impediments to imports and openness to services trade, the CDI attempts to capture the effect of this “market protection” on developing countries.
This year we’ve decided to assess agricultural subsidies separately so their policy impact is clearer. In previous CDIs, agricultural subsidies were converted into their tariff equivalent, and then added to tariffs to produce a measure of overall “market protection.” In order to separate tariffs and subsidies we need to assign respective weights in the index. In other words, do tariffs or agricultural subsidies inhibit trade more?
Below we look at each in turn.
What trade tariffs do developing countries face?
Assessing tariffs is a major analytical task. There are some 5,300 different product categories and tariffs differ between them and bilaterally across country partners. Many tariff assessments are flawed due to what has become known as the “endogeneity problem”: they understate the distortive effect because there is little trade in products with high tariffs (leading them to be underweighted). David Roodman, the creator of the CDI, developed a method that overcame this—weighting tariffs by production, instead of trade volumes. The data for this method is not available past 2007—but the “Roodman” effective applied tariff on developing country trade was estimated around 7.7 percent across CDI countries (this includes tariffs on agricultural products which averaged 28 percent). Even though many rich countries grant reductions in tariffs for developing countries (“preferences”), this estimate is only just below the global average trade tariff which applies outside of trade deals of 9 percent in 2013 (i.e., the applied tariff for the “most favoured nation”).
So, in previous years across the 27 CDI countries, the effective tariff using Roodman’s method, and weighted across all sectors, averaged just under 8 percent.
How distortive are agricultural subsidies?
Agricultural subsidies increase domestic output, lower prices and reduce imports. This creates an uneven playing field in a sector that’s a large part of developing economies.
Agricultural subsidies are usually expressed as a proportion of production. Some subsidies are more more damaging than others (for example, the EU’s “decoupled” subsidies are less distortionary as they are not directly dependent on production levels) but the overall subsidy rate, as proportion of agricultural output using OECD data, is now around 13 percent for CDI countries.
Previous editions of the CDI drew on Cline (2002) to convert subsidy levels into tariff-equivalents. Higher subsidies increase domestic output, lower prices and reduce imports. Cline’s model also suggests the impact is higher for a given level of subsidy if a country’s imports were small relative to its domestic production (this is an arithmetic point—a given proportional increase in domestic production from subsidy would have a higher impact on imports when they were a low proportion). So, these variables also fed into the CDI tariff-equivalent estimates for each country, visible in table 6 of Roodman (2013).
Using Cline’s approach, the average tariff-equivalent of agricultural subsidies was between 10 percent and 15 percent in the relevant years in the CDI. However, this estimate only applied to the agriculture sector—which accounts for roughly a sixth of developing economies. So, averaging the effect over an entire economy implies they’d be equivalent to a tariff on all sectors of perhaps 2 percent.
Tariffs appear more distortionary than subsidies
Based on the Roodmand and Cline methods above, effective tariff levels were just under 8 percent and the (whole-economy) tariff-equivalent of agricultural subsidies were roughly 2 percent. This suggests tariffs were more than three times as distortionary as agricultural subsidies in CDI countries.
The new trade tariff and agriculture subsidy indicators in the CDI trade component will therefore be weighted to reflect these respective impacts. These weights will be kept under review in the light of new research or new data on tariffs and subsidies (alas neither have moved transformatively in the last decade).
CDI 2017 and next steps
The updated CDI will use the latest data on agricultural subsidies, and newer “average applied tariff” data from MacMap (which correlates strongly with Roodman’s measure). These scores will help rank countries on trade, as well as on their overall commitment to development. We'll also be making the spreadsheets behind the CDI full calculations available for the first time.
Of course, this is far from the final word on measuring the developmental impact of subsidies and tariffs. On tariffs in particular, we hope to bring in a poverty-weighting—where tariffs against trade partners count more where income per head is lowest. Comments and suggestions on our current and future approach are very welcome.
Note: This post was updated to reflect that the CDI results are now available online.
Disclaimer
CGD blog posts reflect the views of the authors, drawing on prior research and experience in their areas of expertise. CGD is a nonpartisan, independent organization and does not take institutional positions.