As Lant Pritchett reports, the World Bank has introduced two new poverty lines: $3.20 for lower middle income countries, and $5.50 for upper middle income countries. I’m with Lant that this is broadly a good thing. But the process by which the World Bank came up with its new poverty lines suggests it might be worth revisiting some of the pitfalls of income thresholds at the individual or national level. Grouping people’s or countries’ income classifications can help illustrate trends and features—but woe betide the analyst who takes the classifications too seriously and acts as if they reflect discontinuities in the underlying income distributions. They don’t.
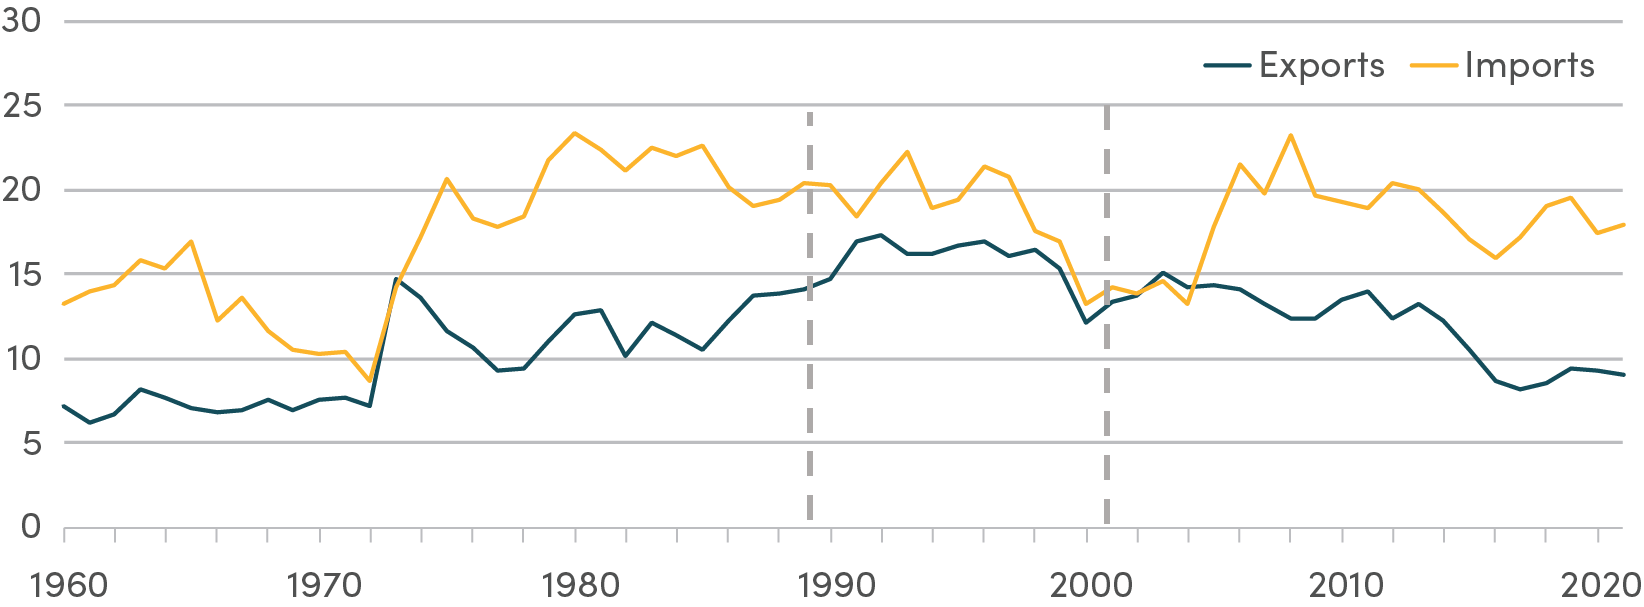
The source of the new Bank poverty lines is illustrated by the below chart from the Bank’s blog announcing the new poverty cutoffs. $3.20 is the median poverty line for lower middle income countries (GNI/capita between $1,005 and $3,955), while $5.50 is the median poverty line for upper middle income countries (GNI/capita between $3,956 and $12.236). This has some odd implications. Imagine a country sees distribution-neutral economic growth that takes it from a GNI per capita of $3,000 to $4,000—crossing the threshold into upper middle income status. The average person’s income will go up by about 25 percent. The average poor person’s income will go up about 25 percent. But because the poverty line has changed from $3.20 to $5.50 (an increase of 72 percent), the number of people that the Bank says are poor will go up, too.
Figure 1. National poverty lines increase with national income

Figure by Francisco Ferreira and Carolina Sanchez, World Bank (Click to view)
Or put it another way: “You are 'poor' because you live in 1 of 56 countries with a GDP per capita between $3,956 and $12,235 on less than the median poverty line of those 56 countries” is not something that is immediately intuitive. And one big reason it isn’t immediately intuitive is that the World Bank’s income thresholds are utterly arbitrary lines drawn through per capita income data, which means a poverty line set at the median of those countries is pretty arbitrary, too.
Grouping people and countries by income categories even if they are just selected for convenience can be helpfully illustrative. That the proportion of people worldwide living on less than $1.90 a day has dropped from somewhere around half some time the 1950’s to around 10 percent today tells you something about declining absolute deprivation and rising incomes. That the number of countries where GNI per capita is below $1,005 (AKA the middle income threshold) has been rapidly declining suggests something similar. But any such line has to be used with care, otherwise it can obfuscate more than it illuminates. I’d argue that’s the case with the World Bank’s new poverty lines.
To take other examples of when such division leads to lack of clarity:
-
People can claim “global poverty is getting worse” because the absolute number of people worldwide living on less than (say) $7.40 a day has been rising.
Think instead: The number has been increasing because people in poor countries are living longer (so there are more of them), not because they’ve been getting poorer. The income of the average person living under $7.40 a day has been rising.
-
A bunch of countries get a little bit richer and cross the line from low to middle income and suddenly the “global poverty problem” has changed and is about middle income countries.
Think instead: Countries with a GDP per capita just a bit above $1,005 are still really poor, and the poorest people worldwide are still concentrated in really poor countries.
-
China has pretty much wiped out $1.90 poverty, is at the upper end of upper-middle income status and so you might think it is now rich.
Think instead: average consumption in the country is still only $288 a month and 400,000,000 people (more than the population of the US) still live on less than $5 a day (give or take, one third of the US poverty line).
-
People cross the threshold of $1.90 or $5 or $10 a day and become valuable middle class citizens who will preserve liberal democracy and improve the quality of government services.
Think instead: some attitudes vary a lot by absolute income, others don’t, but there’s no evidence of uniquely middle class values emerging at any particular income cutoff.
-
That few countries (in the 1990’s) went from low to middle income or (in the last few decades) have gone from middle to high income, suggests that countries a bit below one of these arbitrary lines have trouble crossing that line—escaping a poverty trap, or the middle income trap.
Think instead: growth varies a lot across countries and over time, but there’s no evidence (see this CGD blog post and working paper) of growth slowing when countries near a GNI per capita of $1,005 or $12,235.
I’m not citing those beliefs because most of the original authors were better scholars than to suggest such things in nearly so stark terms, but I do think these interpretations are pretty common in the development discourse. And they’re driven by over-interpreting income cutoffs. In short, existing poverty and income classification lines obscure an underlying truth—there is no discontinuity at the income line except that created by the existence of the line itself.
Disclaimer
CGD blog posts reflect the views of the authors, drawing on prior research and experience in their areas of expertise. CGD is a nonpartisan, independent organization and does not take institutional positions.