This week the IMF released new global economic growth projections in the face of COVID-19, updating their earlier projections from June and from April before that. In recent weeks, the World Bank has also released new projections for various regions. Here are six takeaways that we gleaned from reviewing those and dozens of other projections from other organizations over the course of the year.
1. This year was worse for low- and middle-income countries than predicted. Repeatedly.
In January, the IMF’s projection of global growth for 2020 was 3.3 percent, an increase over 2019’s global growth rate of 2.9 percent. By April, that global estimate had not just slowed but reversed, to -3.0 percent. June estimates were even lower (-4.9 percent), and this week’s estimates—now more than three quarters of the way through the year—landed us at -4.4 percent (Figure 1).
Figure 1. IMF global and regional projections for 2020, by month of publication of projection
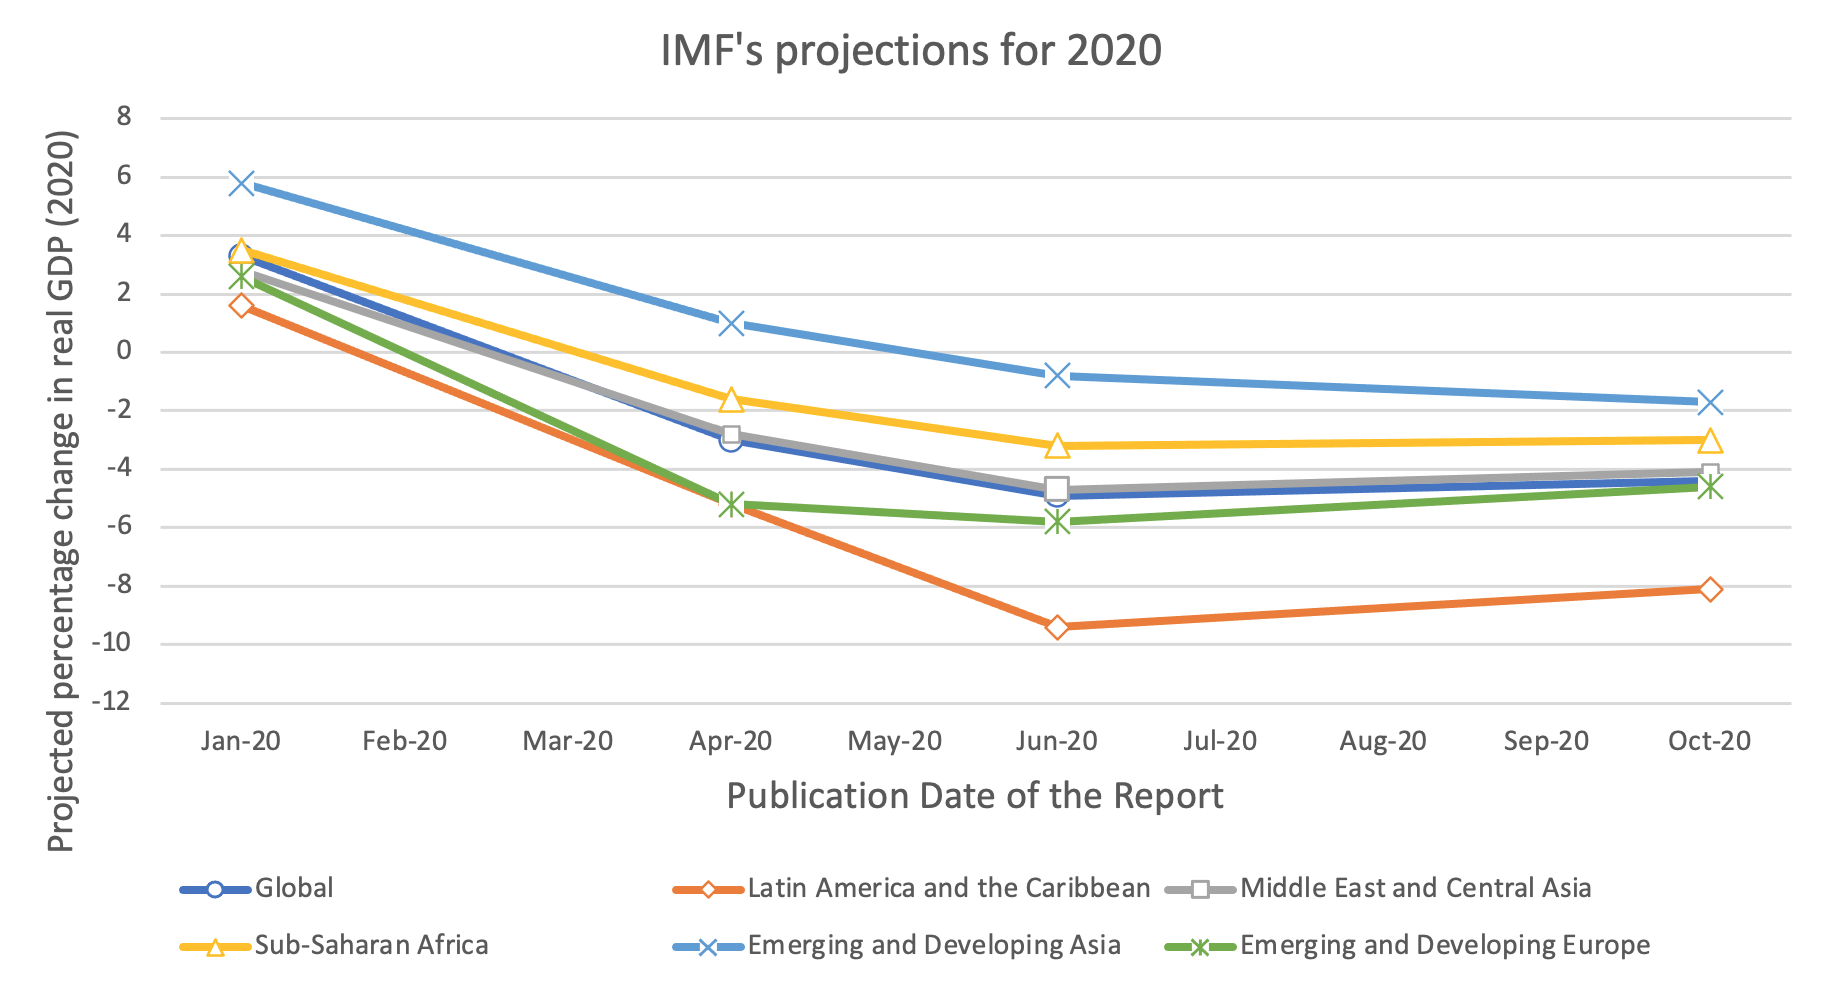
Source: Authors’ construction based on IMF January 2020, IMF April 2020, IMF June 2020, and IMF October 2020 forecasts.
But while high-income countries are the hardest hit on average, the projected growth in low- and middle-income countries has also dropped significantly. The figure above shows that region after region has downgraded growth projections, not just relative to January but also relative to April.
The IMF projections for a few middle-income countries are particularly striking. India, Mexico, and South Africa have been particularly hard-hit. Economic growth in India was 4.2 percent in 2019. The current projection for India in 2020 is -10.3 percent, the largest drop reported by the IMF for any low- or middle-income country. That’s 5.8 percentage points worse than what the IMF was projecting in June. Mexico now has projected growth of -9.0 percent. South Africa is at -8.0 percent.
World Bank projections have shown a similar downward trend, as you can see in Figure 2. South Asia and Latin America and the Caribbean have shown particularly negative trajectories. Despite the pandemic arriving late to Latin American countries, it has now become the worst-hit region in the world, at one point accounting for over half of daily coronavirus deaths. Similarly, India is second only to the US in number of cases and the country’s economy severely contracted in the second quarter of the year, much worse than previously expected.
Figure 2. World Bank regional projections for 2020, by month of publication of projection
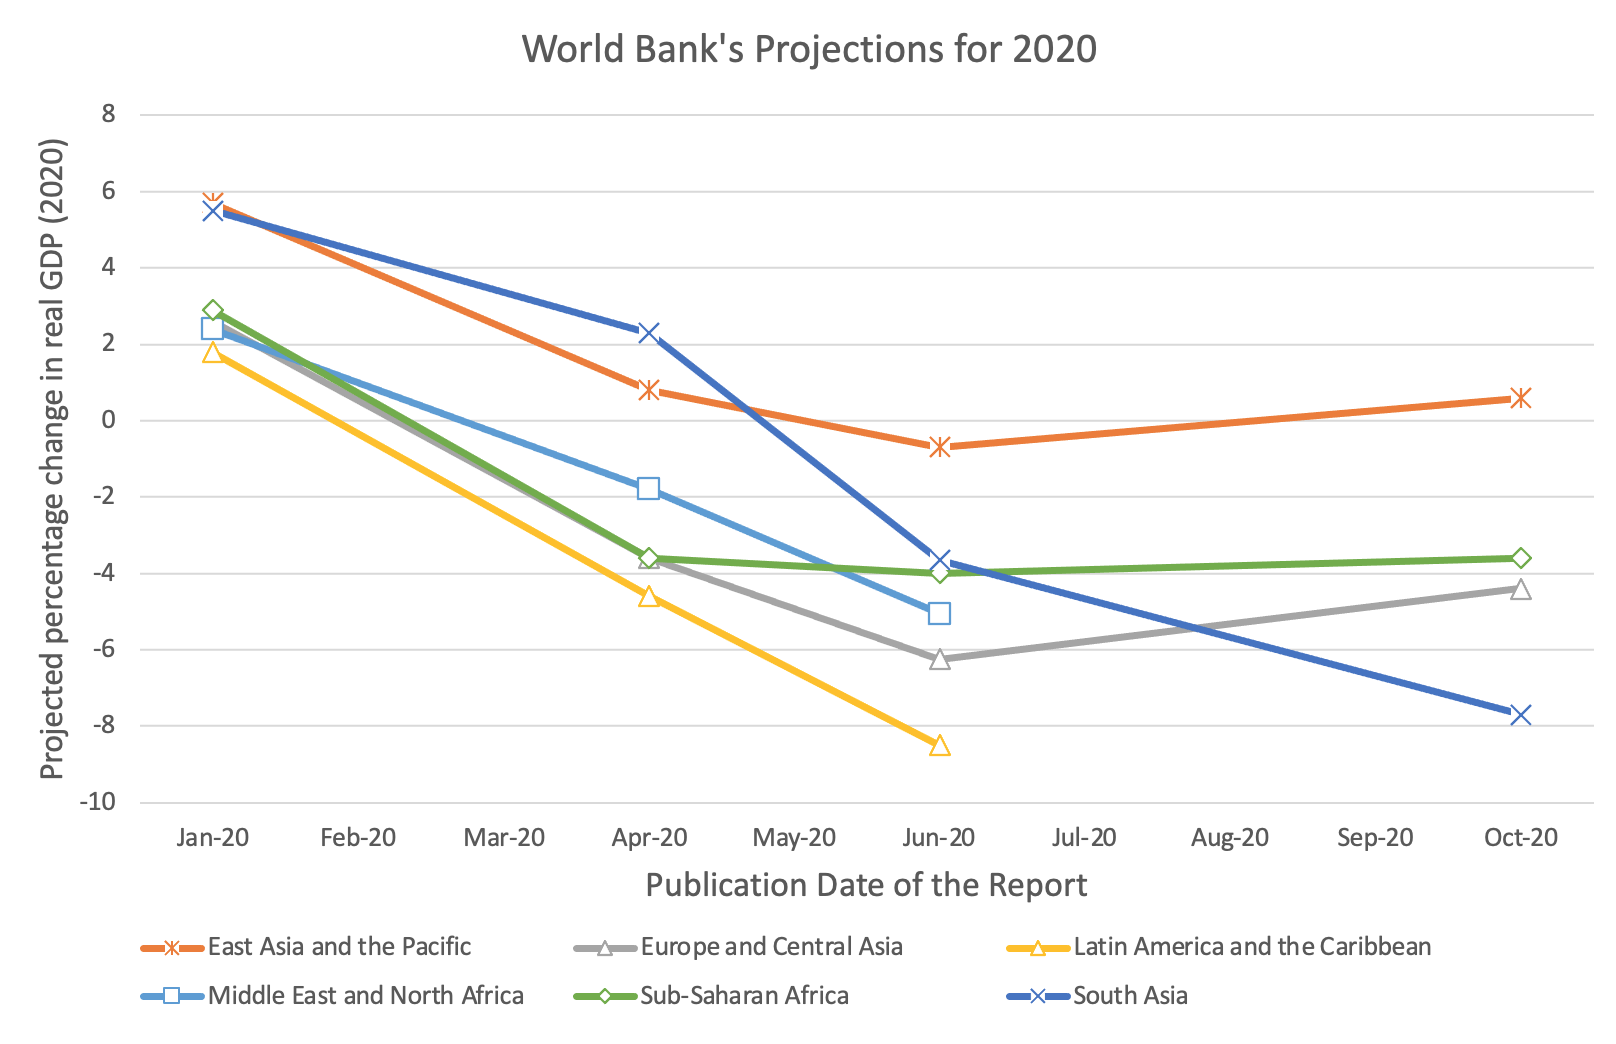
Source: Authors’ construction based on World Bank’s forecast released in January 2020, the regional forecasts released in April 2020, forecast updates released in June 2020, an update in September 2020, and the recently released forecasts (October 2020).
Strikingly, the 2020 projections were much worse for low- and middle-income countries than for rich countries (Table 1). To use the IMF’s groupings, the 2020 projections changed by 5 percent between April and October for advanced economies, but they changed by 230 percent for emerging markets and developing economies. Likewise, low-income developing countries have an updated projection that is 400 percent lower. These percentage numbers are big in part because we’re dealing with changes of small numbers, but the updates are much bigger for low- and middle-income countries. Furthermore, the projections for 2020 are worse now for each of these developing regions, whereas they are slightly better for the advanced economies. Earlier in the year, Sandefur and Subramanian highlighted that the IMF’s predicted economic impact of COVID in low- and middle-income countries was lower than could be explained by “external vulnerabilities to trade disruptions, financial crises, or commodity price shocks” (i.e., the growth estimates were too optimistic). That has unfortunately proven true.
Table 1. Difference between IMF October projections from the April projections, by selected country groups
| Projections for 2020 | Projections for 2021 | |||||||
|---|---|---|---|---|---|---|---|---|
| April | October | Percentage point change | Percentage change | April | October | Percentage point change | Percentage change | |
| Advanced economies | -6.1 | -5.8 | 0.3 | +5% | 4.5 | 3.9 | -0.6 | -13% |
| Emerging markets and developing economies | -1.0 | -3.3 | -2.3 | -230% | 6.6 | 6.0 | -0.6 | -9% |
| Low-income developing countries | 0.4 | -1.2 | -1.6 | -400% | 5.6 | 4.9 | -0.7 | -13% |
| Emerging and developing Asia | 1.0 | -1.7 | -2.7 | -270% | 8.5 | 8.0 | -0.5 | -6% |
| Latin America and the Caribbean | -5.2 | -8.1 | -2.9 | -56% | 3.4 | 3.6 | 0.2 | +6% |
| Middle East and Central Asia | -2.8 | -4.1 | -1.3 | -46% | 4.0 | 3.0 | -1.0 | -25% |
| Sub-Saharan Africa | -1.6 | -3.0 | -1.4 | -88% | 4.1 | 3.1 | -1.0 | -24% |
Source: Authors’ construction based on IMF World Economic Outlook April 2020 and October 2020.
2. Africa has not been spared.
The COVID pandemic’s health impact has been less marked on the African continent than elsewhere. That’s not to minimize its effects, with more than 1.2 million cases and over 27,000 deaths to date. But as journalists ponder whether the pandemic has “spared” the continent, the economic storm is clear. The IMF projection for growth across Sub-Saharan Africa in 2020 was 2.9 percent in January, -1.6 percent in April, and this week’s projections put it at almost twice as bad as that, at -3.0 percent. Last week’s numbers from the World Bank project a slightly worse -3.3 percent (consistent with the World Bank’s numbers from April). But these total output numbers don’t factor in population growth. Per capita income across the continent is expected to fall by 6.5 percent. Per capita GDP had already begun to fall in 2016, but this represents a drop-off, as Figure 3 shows.
Figure 3. Per Capita GDP in Sub-Saharan Africa over time
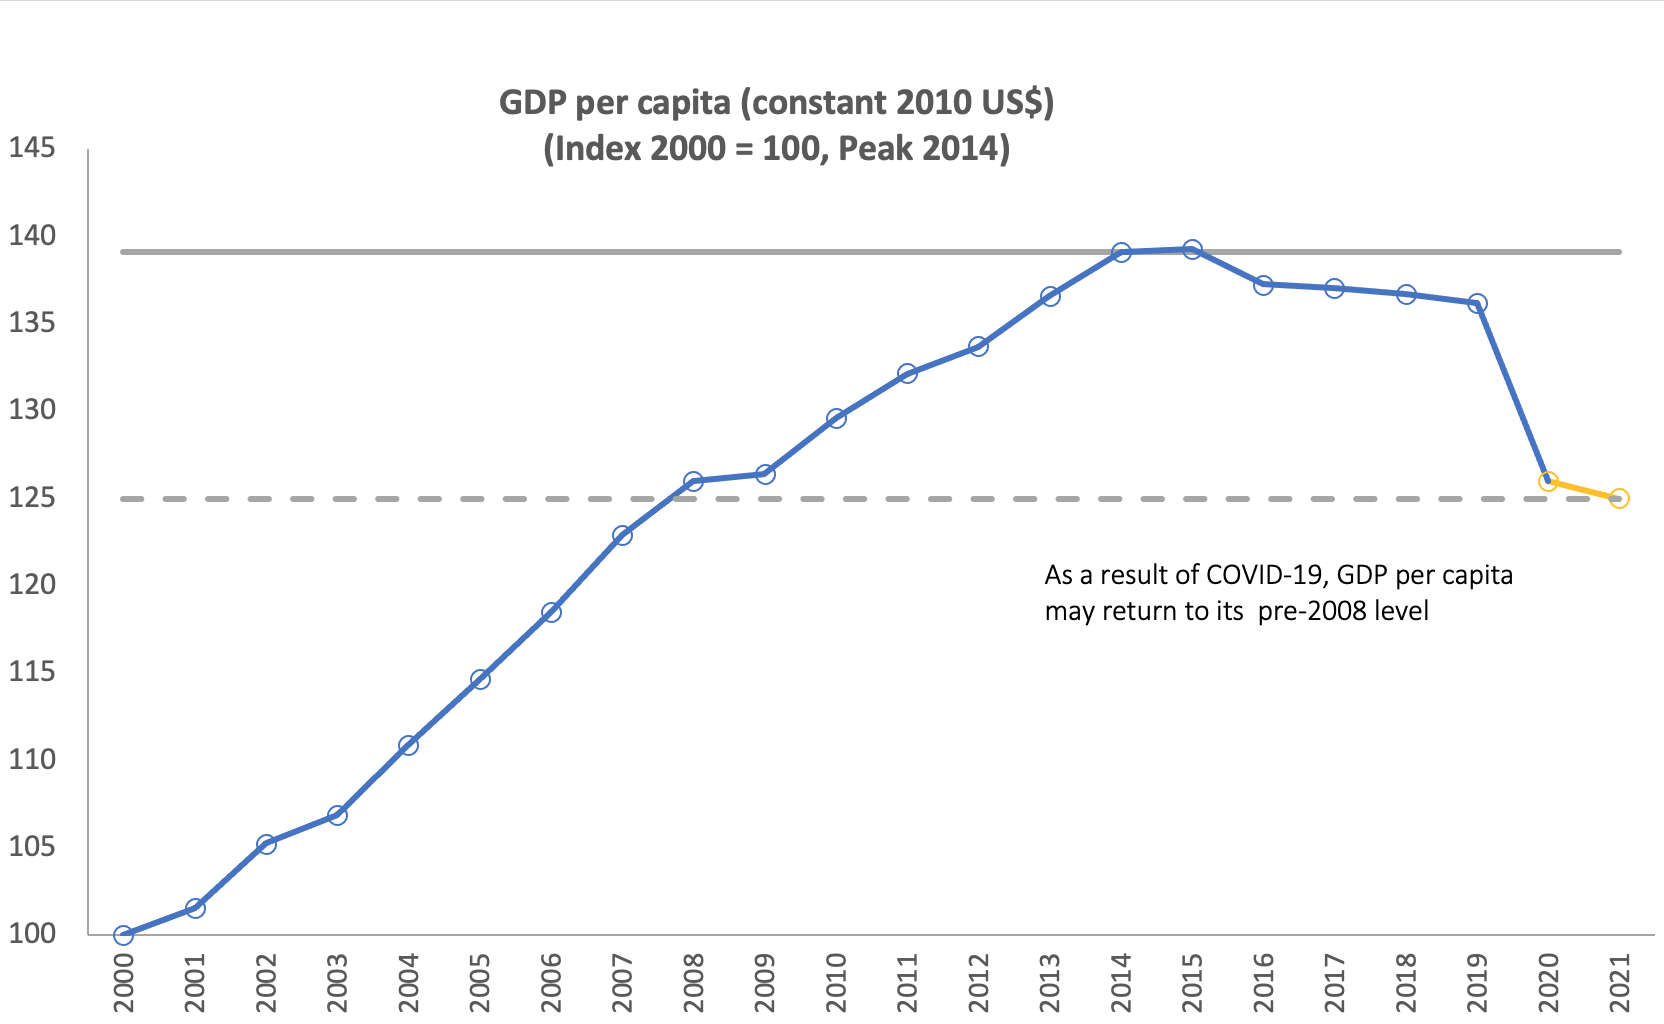
Source: Authors’ construction based on World Development Indicators 2020. (Recreated from Figure 1.52 in Africa’s Pulse, October 2020.)
This decline over the course of 2020 is consistent across projections for Africa from various organizations. A range of groups have produced forecasts for either Africa as a whole or for Sub-Saharan Africa, and later forecasts have been consistently lower (Figure 4).
Figure 4. Africa and Sub-Saharan Africa projections for 2020, by month of publication of projection
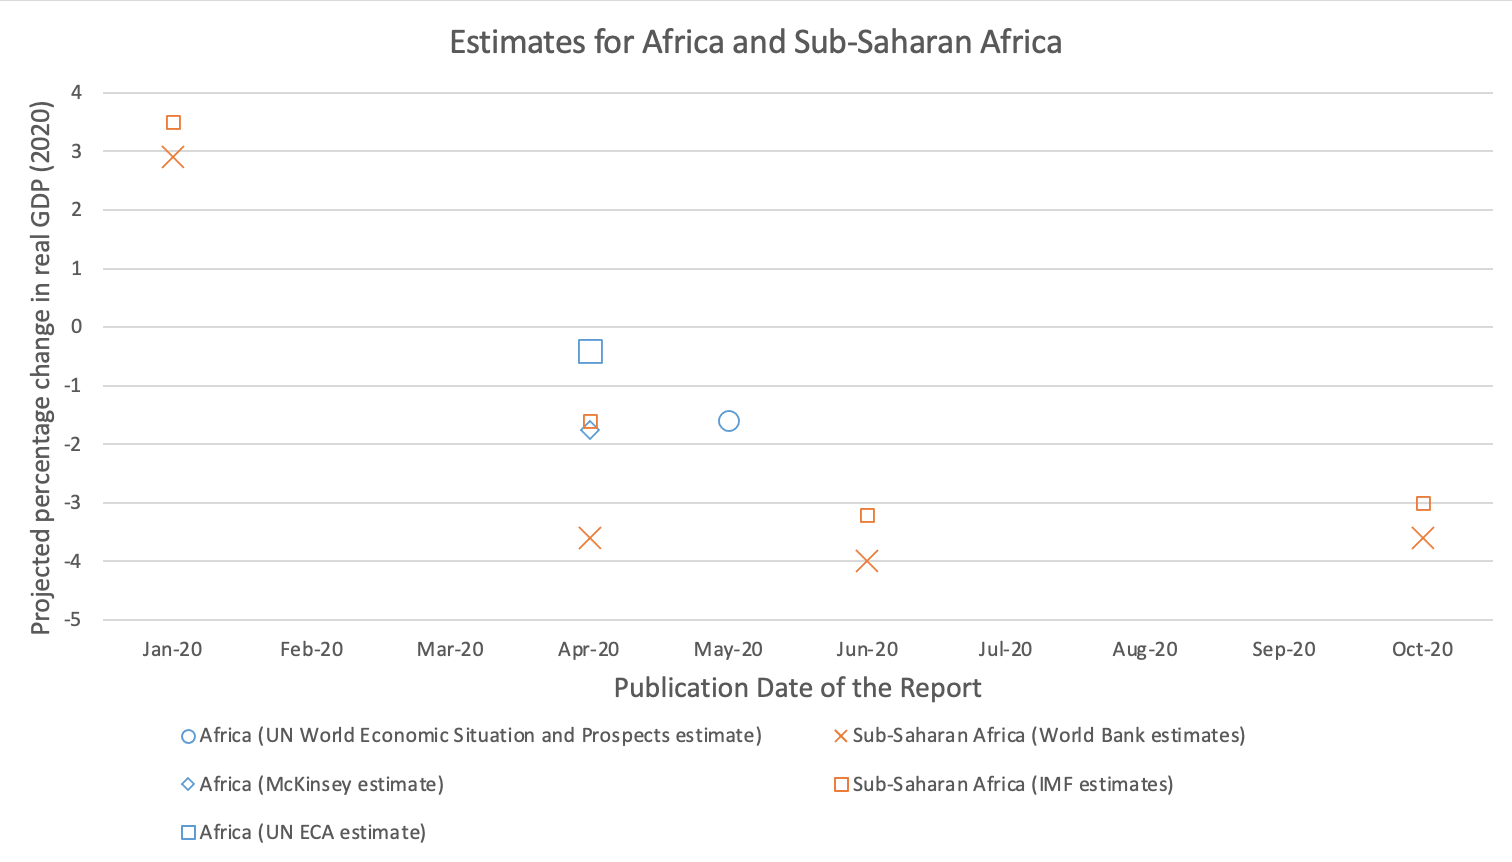
Source: Authors’ construction based on a McKinsey report (April 2020), UN ECA report (April 2020), UN World Economic Situation and Prospects (May 2020), IMF forecasts (January 2020, April 2020, June 2020, and October 2020), and World Bank forecasts (January 2020, April 2020, June 2020, and October 2020).
3. Lockdowns aren’t the only reason for slowing economic activity. People are also avoiding each other.
Using data for 128 countries, the IMF report examines the impact of lockdowns on mobility (as one proxy for economic activity) in both high-income and low- and middle-income countries. It also examines mobility drops from COVID cases beyond the effect of lockdowns. This is likely driven by voluntary social distancing, a manifestation of what Evans and Over refer to as “aversion behavior” (i.e., people avoiding activities where they might catch the virus). They find that both lockdowns and voluntary social distancing reduced mobility. In low-income countries, about two thirds of the effect on mobility was from lockdowns. In higher-income countries, the effect was more balanced across the two.
The IMF report cautions against jumping to the conclusion that lockdowns are the problem: “Despite lockdowns having negative short-term economic effects, letting infections grow uncontrolled can also have dire economic consequences. This is because voluntary social distancing in response to rising COVID-19 infections has severe detrimental effects on the economy.” In Latin America, there are a couple of examples suggesting that lockdowns implemented well—before transmission could get out of hand and effectively managed by the government, including providing clear and consistent information to the people—may have help flatten the curve with only reasonable cost to the economy.
4. 2021 looks better, for now.
Projections for 2021 still point to recovery, despite the fact that the spread of the virus has persisted beyond what was assumed in the early 2020 projections (Figure 5). Reports published in April and May assumed containment of the pandemic within the first half of 2020, combined with the pandemic fading on its own and a robust recovery by the end of the year. (This was potentially modeled after China’s recovery in March.) However, as cases piled on and lockdowns continued for many of the affected countries, assumptions have shifted from when containment will take place to when vaccines will be available and deployed. While some of the more recent reports acknowledge that the pandemic may be with us for a while—for example, the IMF October report assumes that social distancing measures will spill over to 2021 and a World Bank regional projection assumes that we will still have a quarter of the current magnitude of the outbreak in 2022 —generally, the reports account for the swift and sizable fiscal policies governments have deployed and still project a recovery in the coming year. That said, the projections for 2021 have updated much less than the projections for 2020 (see Table 1 above), and the further out we get, the more uncertainty there is. Estimates by a team at CGD suggest that a vaccine may not even be approved until well into 2021, without even considering purchase and distribution.
Figure 5. IMF regional projections for 2021, by month of publication of projection
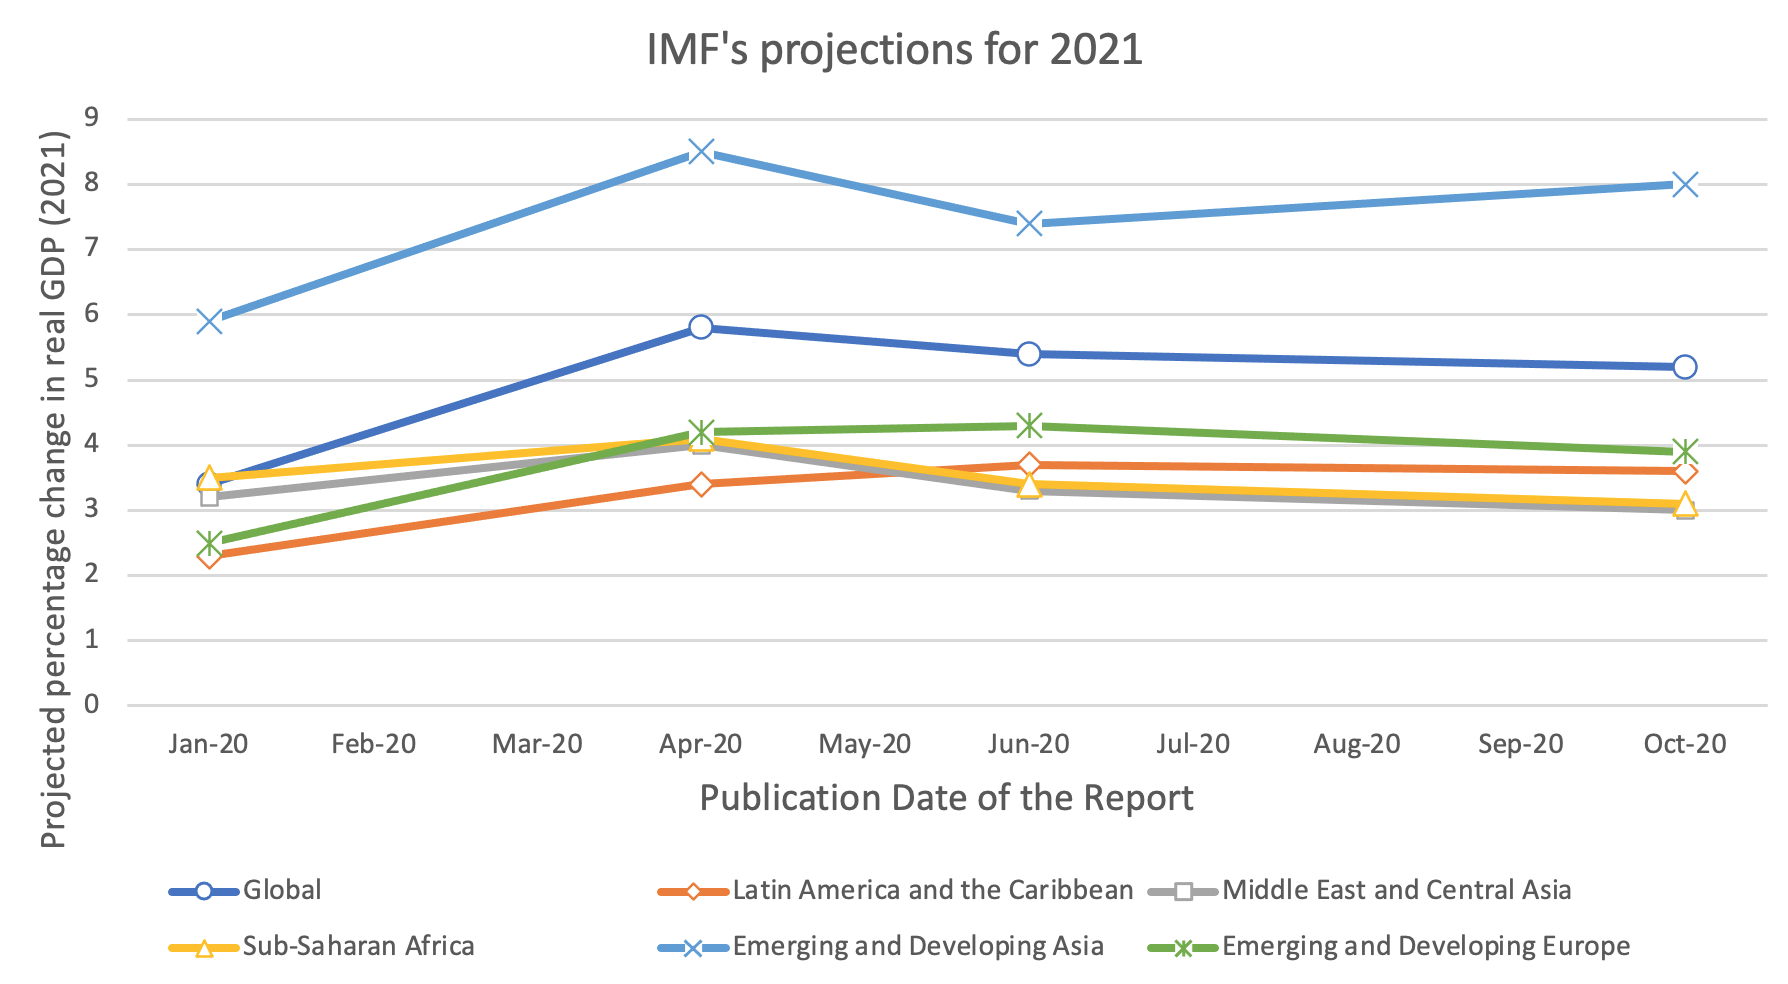
Source: Authors’ construction based on IMF January 2020, IMF April 2020, IMF June 2020, and IMF October 2020 forecasts.
5. These growth numbers have real impacts.
It can be easy to get lost in these aggregate output numbers and forget the human lives behind them. The negative GDP growth projections reflect lost income for the majority of the world’s population, especially those employed in industries dependent on open borders and working supply chains (such as the service, tourism and agriculture industries) and the informal sector. Last week, a World Bank team released new poverty projection numbers. They estimate 88 million additional people in extreme poverty (that’s $1.90-a-day poverty) in 2020 as a result of COVID. The vast majority of those are in South Asia (remember those terrible growth numbers for India?) and in Sub-Saharan Africa (where the growth numbers aren’t as bad, but many people are close to the extreme poverty line). Here’s a word from the team: “Using the data and projections available now, it appears that COVID-19 has already been the worst reversal on the path towards the goal of global poverty reduction in at least the last three decades.” While the extreme poverty numbers are lower in Latin America, that region has the worst growth forecast among all developing regions, with projected increases in less extreme poverty, leading some to reference a potential “lost decade” for the region.
Those poverty increases translate to increased food insecurity, fewer resources to invest in education and health, and lower tax revenues for governments to provide services.
6. The projections are wrong. (They’re always wrong.) That doesn’t mean they aren’t useful.
Economic forecasts are often wrong, which is unsurprising given the number of variables at play. But they are often reasonably accurate in the short run, which suggests that we may be close to understanding 2020 (even as it draws to a close). We should take projections for 2021 with a few grains of salt.
This analysis suggests two challenges for future projections. The first is to improve assumptions about both the spread of the virus and the reactions to it (like vaccine development). But we recognize that this is easier said than done. The virus was raging in April, but its future trajectory remained highly uncertain (as it does now). The second is to seek to improve the quality of the forecasts in low- and middle-income countries. Existing analysis suggests that should be possible.
All that said, the assumptions on risks detailed in the forecasting reports, together with the analysis of particular weaknesses of the economies, can prove useful for policymakers needing to make hard choices. Gill writes for Brookings that forecasts during the global financial crisis of 2009 were dire, but that the world bounced back much more quickly than predicted. So perhaps there can be optimism for 2021, with continued, concerted effort to contain the virus and keep economies—including the most vulnerable within them—supported.
The order of authors on this blog post was determined by a virtual coin flip. This post benefitted from comments from Amanda Glassman and Justin Sandefur.
Disclaimer
CGD blog posts reflect the views of the authors, drawing on prior research and experience in their areas of expertise. CGD is a nonpartisan, independent organization and does not take institutional positions.