There’s a growing conventional wisdom that for financing development, official development assistance (ODA) is declining in importance compared to private capital flows (PCFs). Foreign direct investment (and other private flows) are outpacing aid in many places, and indeed, ODA will be insufficient to cover the estimated $2.5 trillion in additional funding needed to finance the Sustainable Development Goals—especially with many donor country aid budgets under increased pressure. The world, as they say, is moving “beyond aid.”
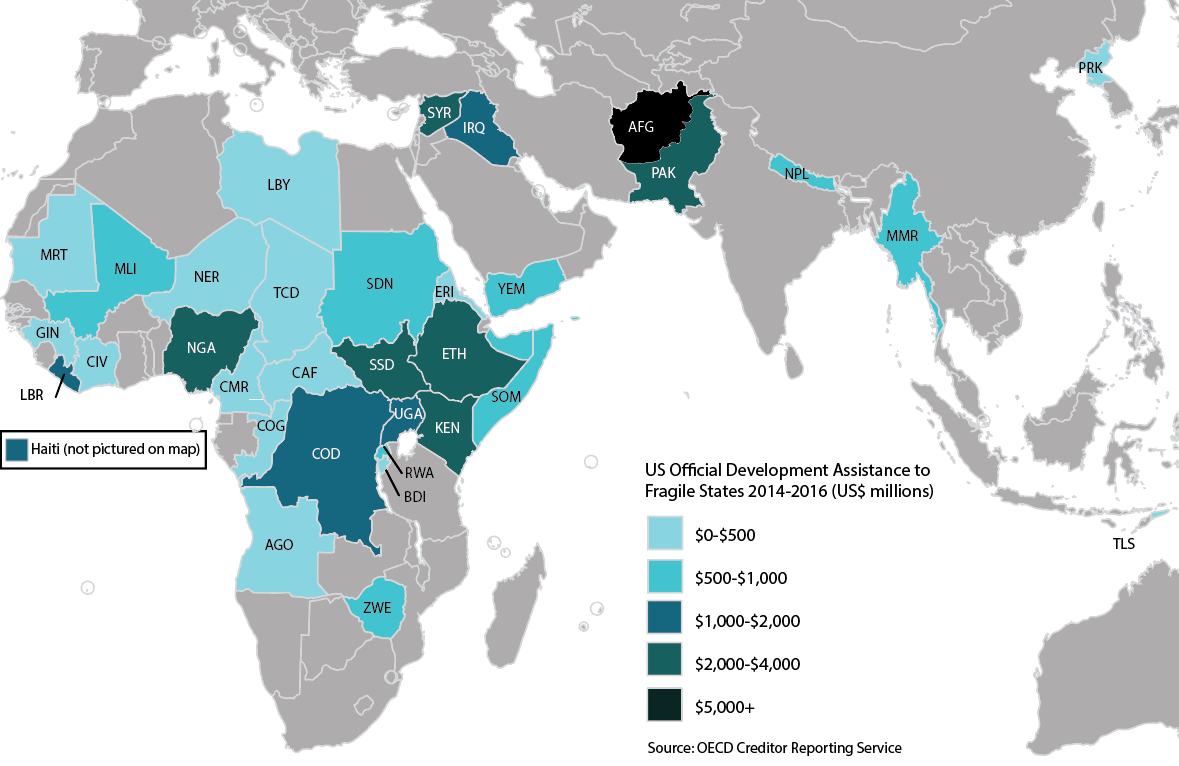
As true as that may be in aggregate, however, the trend doesn’t apply evenly across groups of countries. While fairly significant data gaps (see below for more detail) prevent a complete and unbiased picture, the available data show that ODA remains a comparatively prominent source of external financing for fragile states (see our previous blog on what US aid to fragile states looks like).
ODA is a comparatively prominent source of external financing in fragile states
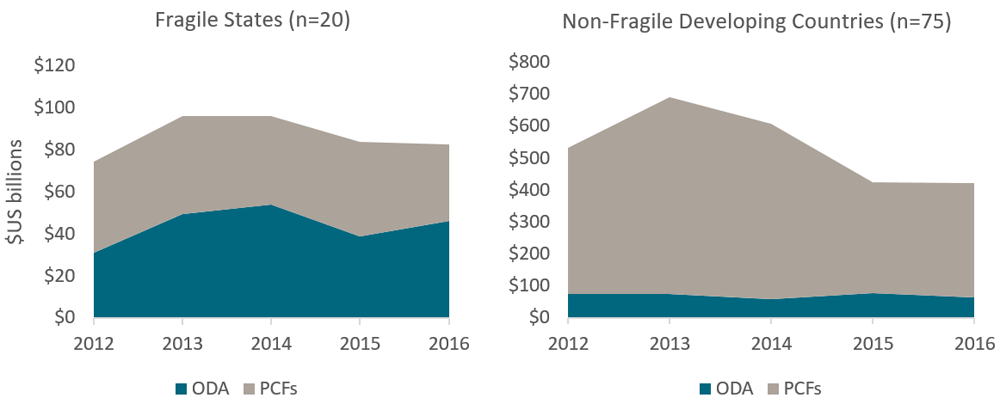
Note: ODA data is from OECD CRS and includes all donors. PCF data is from the IMF World Economic Outlook and includes FDI, portfolio flows, and bank/other flows. The “fragile states” group includes the 20 countries that scored above a 90 on the Fragile States Index and had complete PCF data in the IMF database. These 20 fragile states are also included with their respective income group bucket (9 LICs, 10 LMICs, 1 UMIC). Income groups are determined by the World Bank (2016 categorizations). Out of 133 developing countries, 41 were excluded due to incomplete data (breakdown, including 12 fragile states: 12 LICs, 10 LMICs, 19 UMICs).
As the graphs above show, while external finance to fragile states is split roughly evenly between ODA and private capital flows, aid makes up a far larger share of total flows in fragile states than it does in non-fragile low- and middle-income countries. Part of this effect is undoubtedly related to income level since most (59 percent) of fragile states are low income and most (63 percent) of low-income countries are fragile (per our definitions).
Most fragile states receive more ODA than private capital as a percent of GDP
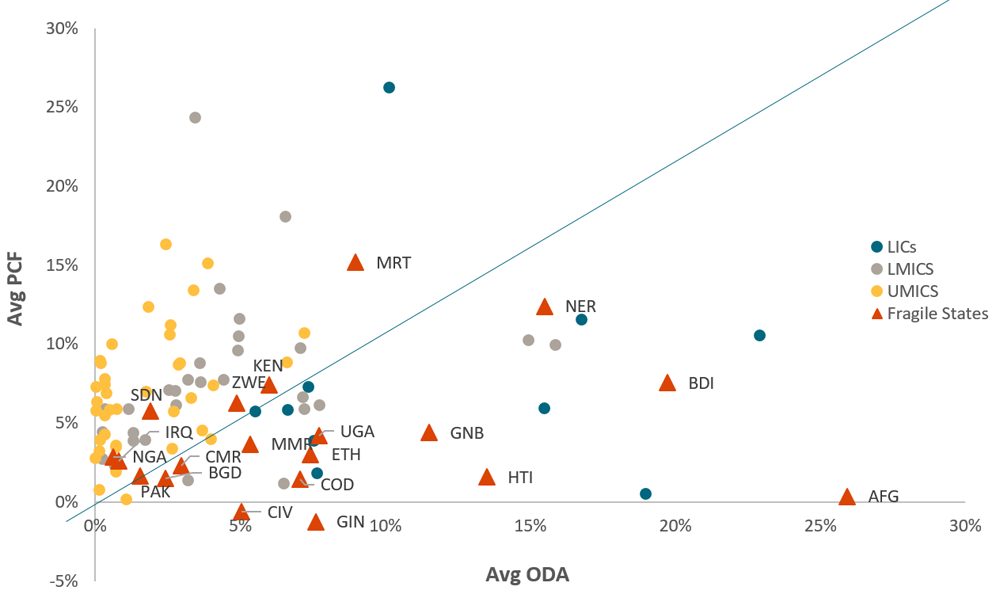
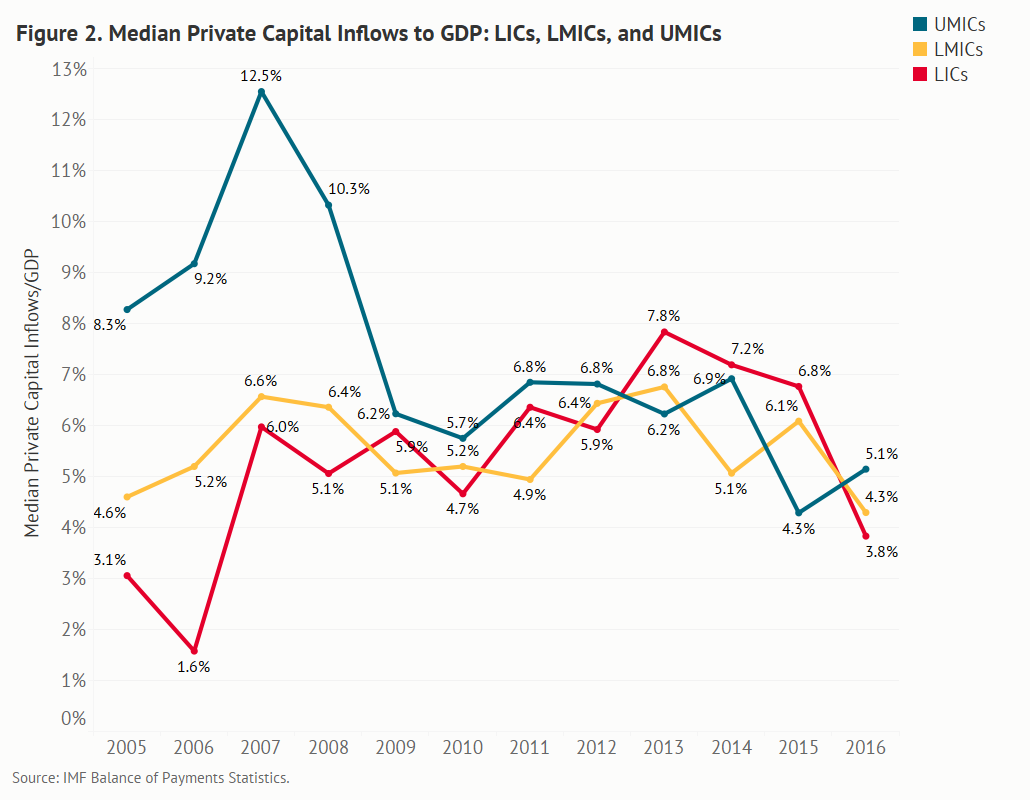
Looking at aid and private capital flows at the country level as a percent of GDP shows the story another way. Above the 45-degree line are countries that receive more private capital flows than ODA as a percent of GDP over the past five years (2012–2016)—these are almost exclusively middle-income countries. Countries below the line—almost all low-income countries and most fragile states—receive more ODA as a share of GDP. That said, as our colleagues Nancy Lee and Asad Sami point out, as a percent of GDP, private flows to many low-income (and, as we see here, fragile) countries are on par with those to many middle-income countries; there’s little correlation between private capital inflows/GDP and country per capita income.
Private capital flows are concentrated in a small number of fragile states
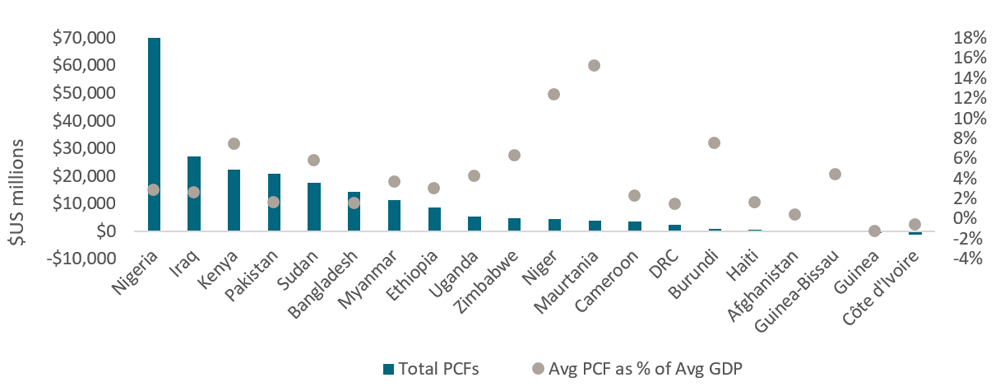
Note: PCF/GDP calculation is the average of PCFs to each country from 2012 to 2016, and GDP is the average over the same period.
As the figure above shows, averages conceal substantial heterogeneity. For most fragile states, private flows are minimal. In fact, 90 percent of private capital flows to this set of 20 fragile states goes to just nine countries, and a third of private flows goes to just one country: Nigeria. Nigeria, along with Iraq and Sudan (the two other countries with substantial resource endowments) account for more than half of private capital flows to our defined group of fragile states.
Resource wealth is a greater factor in private capital flows to fragile states than it is for non-fragile states
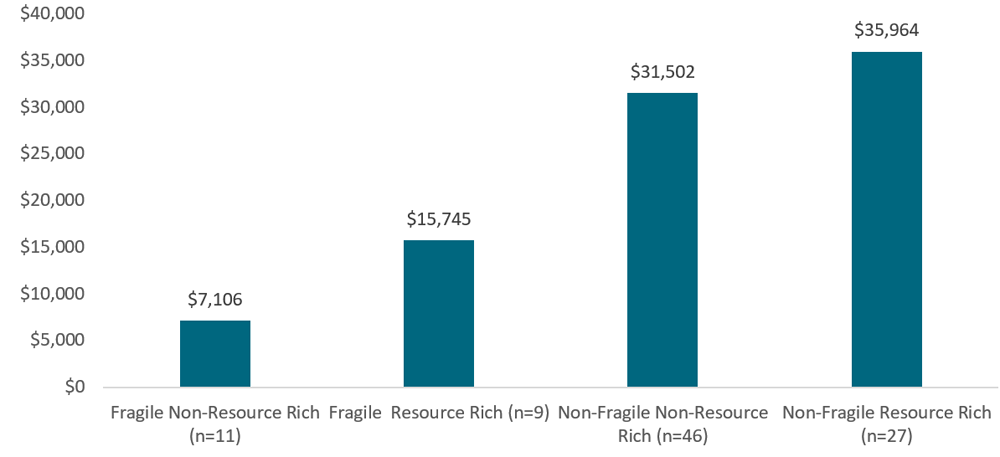
Note: Calculated by totaling five years of PCFs (2012–2016) to each country in the four categories and taking the average of those five-year totals of the countries in each category. See the end of the post for how we define “resource rich.”
In short, fragile states are more likely to attract private flows if they are endowed with natural resources. Over the last five years, resource-rich fragile states received more than twice the amount of private capital flows (on average) than non-resource rich fragile states. On the other hand, the difference in flows between resource rich and non-resource rich non-fragile countries is less pronounced.
The composition of private flows is different in fragile and non-fragile states
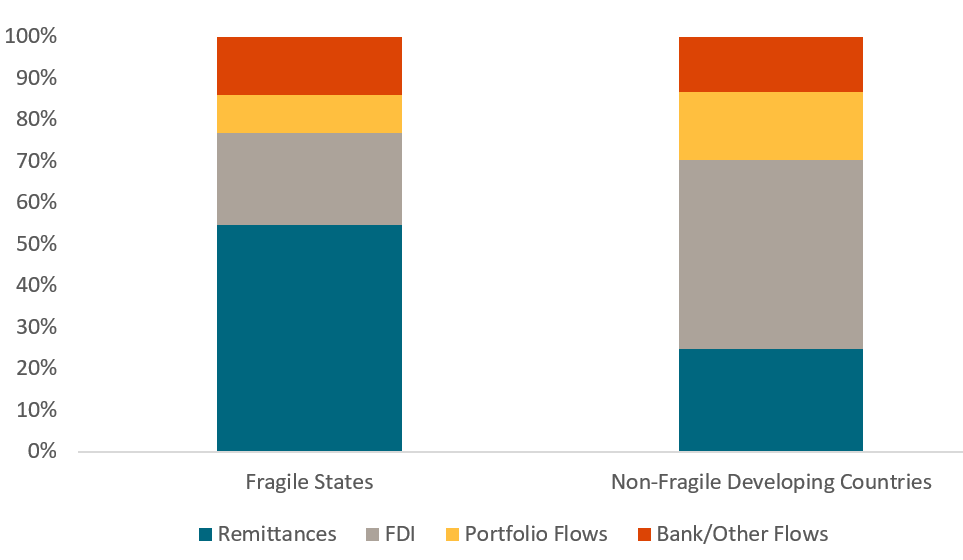
The IMF World Economic Outlook (the source of the data in this blog) includes three distinct private capital flow types in its database: foreign direct investment, portfolio investment (stocks, bonds, other equity), and banking/other flows (all net incurrence of liabilities). It also reports remittances, which we included above to capture a more complete picture of the broader external financing landscape. Fragile states count on remittances for more than half of their external financing over the past five years, in contrast to non-fragile low- and middle-income countries, which attract far more foreign direct investment. Portfolio investment also makes up a larger proportion of private flows in non-fragile compared to fragile states—especially when you consider that over 75 percent of portfolio flows to fragile states in the past five years went to just one country: Nigeria (again).
What’s ahead for development financing in fragile states?
The information presented in this blog offers a few insights into the current financing environment for fragile states, and where we might go from here:
-
Foreign aid remains essential for fragile states, prompting important questions about both the level of aid and its quality. On average, ODA remains the most important source of external financing to fragile states. The kinds of issues that contribute to fragility and hinder the achievement of the SDGs in fragile states often stem from political or governance issues (e.g., lack of legitimacy, inability to provide public goods, lack of control over security). Foreign assistance (when done well) is better suited to deal with those kinds of constraints, while private flows are unlikely to address them (and, in some cases, could exacerbate existing problems). However, the proportion of ODA going to fragile states has changed very little over the last 10 years, even though non-fragile, middle-income countries have disproportionate and increasing access to private capital. Considering this, a careful look at how to prioritize scarce grant resources seems warranted. In addition, the question of how development assistance can be done better in fragile contexts is becoming increasingly important.
-
There is still potential for growth in private flows to fragile states. A portion of ODA—and the development policy that accompanies it—has a role to play in supporting the creation of conditions more favorable to private investment—even in fragile states. The US government has been honing its tools to do just that. USAID’s new private sector strategy, for instance, emphasizes working with the private sector to identify and address barriers to investment. The Millennium Challenge Corporation (which only works with relatively well-governed countries, a handful of which also struggle with fragility) invests in projects that confront the binding constraints to greater private sector-led growth. And while low-income countries have historically made up a small portion of the Overseas Private Investment Corporation’s (OPIC) portfolio, the BUILD Act, which transforms OPIC into a new US development finance corporation, urges a focus on countries “suffering as a result of extreme poverty, fragile institutions, or a history of violence.”
-
But it’s important to be realistic. While aid tools can play an important role in leveraging or crowding in private sector investment in fragile states, it’s perhaps overly optimistic to think these opportunities will be abundant. As our colleagues, Charles Kenny, Scott Morris, and Vijaya Ramachandran point out, the International Finance Corporation has struggled to meet its ambitious targets for increasing the proportion of its portfolio in fragile and low-income states.
A special thank you to Nancy Lee and Asad Sami for sharing a comprehensive database they developed on private capital flows. See their recent blog on three surprises on private capital flows and stay tuned for their future work in this area.
Data Notes:
-
Resource Rich Countries (Average exports of fuels, mining products, precious stones and gold greater than 25% of total merchandise exports over the past five years): Albania, Algeria, Angola, Armenia, Azerbaijan, Belarus, Bhutan, Bolivia, Cameroon, Colombia, Democratic Republic of the Congo, Egypt, Guinea, Indonesia, Iraq, Jamaica, Kazakhstan, Laos, Madagascar, Mauritania, Montenegro, Mozambique, Myanmar, Namibia, Niger, Nigeria, Papua New Guinea, Peru, Sierra Leone, South Africa, Sudan, Suriname, Tajikistan, Timor-Leste, Zambia
-
Non Resource Rich Countries: Afghanistan, Bangladesh, Belize, Benin, Bosnia & Herzegovina, Burundi, Cabo Verde, Cambodia, China, Costa Rica, Cote D’Ivoire, Djibouti, Dominica, Dominican Republic, El Salvador, Ethiopia, Fiji, The Gambia, Georgia, Grenada, Guatemala, Guinea-Bissau, Guyana, Honduras, India, Jordan, Kenya, Kyrgyz Republic, Lebanon, Lesotho, Macedonia, Malawi, Maldives, Mexico, Moldova, Morocco, Nepal, Nicaragua, Pakistan, Paraguay, Philippines, Rwanda, Serbia, Sri Lanka, Tanzania, Thailand, Turkey, Tunisia, Ukraine, Vietnam, Zimbabwe
-
Missing Data Countries (41): Eritrea, South Sudan, Syria, Cuba, Kosovo, West Bank/Gaza, Swaziland, Somalia, North Korea, Bulgaria, Venezuela, Russia, Romania, Equatorial Guinea, Libya, Iran, Ecuador, Turkmenistan, Uzbekistan, Republic of the Congo, Chad, Central African Republic, Liberia, Mali, Senegal, Yemen, Gabon, Malaysia, Togo, Micronesia, Mauritius, Tuvalu, St. Vincent & the Grenadines, Solomon Islands, Kiribati, Vanuatu, Marshall Islands, Tonga, Samoa, Nauru, Sao Tome de Principe
-
Thirty-two countries that scored above a 90 out of 120 on the Fragile States Index in 2018 were considered “fragile” for our sample. Out of those, 12 did not have complete data on private capital flows from the IMF.
-
A country had complete PCF data if it had data available on FDI and other/bank flows in the past five years. If a country had no data on portfolio flows, the IMF considers it to be zero portfolio flows, not unavailable data.
Disclaimer
CGD blog posts reflect the views of the authors, drawing on prior research and experience in their areas of expertise. CGD is a nonpartisan, independent organization and does not take institutional positions.