A top political leader from northern Nigerian once remarked: “In Nigeria, poverty wears a northern cap; if you are looking for a poor man, get somebody wearing a northern cap.”
The official figures show that the poverty rate in Nigeria between 1980 and 2010 rose by 153.6 percent (or 62.76 percent if $1.25 USD/person/day 2005 PPP line is used). The equivalent number of poor people rose from 39.2 million to 112.47 million (see Figure 1). This is despite a rise in the country’s GDP per capita by roughly 19 percent and a 17.1 percent decline in the level of inequality (measured in terms of Gini index).
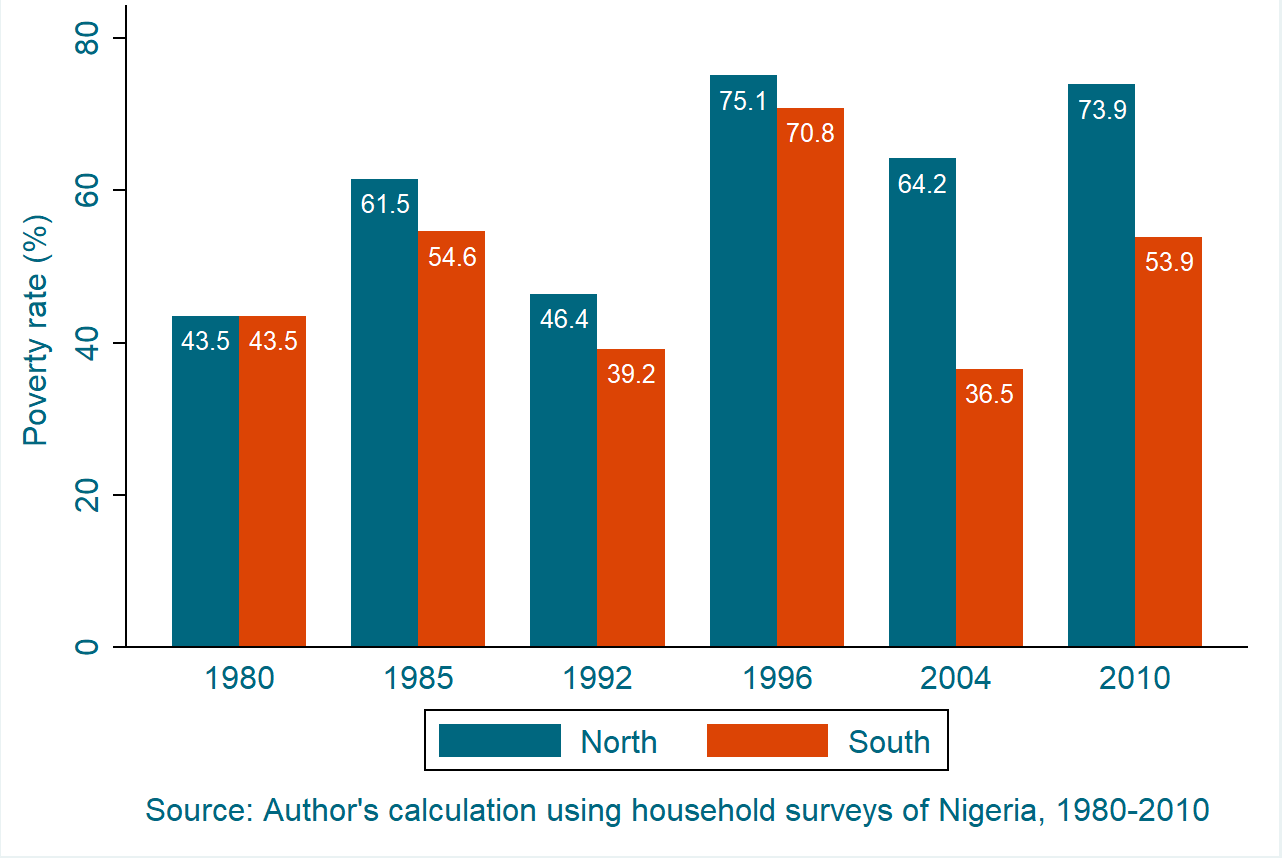
It’s true that much of the rise in poverty emerged from the northern part of the country. For the period that data is available, the gap in poverty between the regions opened after 1980 (see Figure 2; the difference in 1980 is so small that it is not visible when the poverty rates are approximated to two decimal places).
Understanding the rise in poverty in the country is one issue; understanding the forces behind the north-south poverty divide is another. In this blog post, I restrict my focus to the latter: Why is poverty so much greater in the north of Nigeria than in the south?
Figure 1. Poverty rate in Nigeria %, 1980–2010
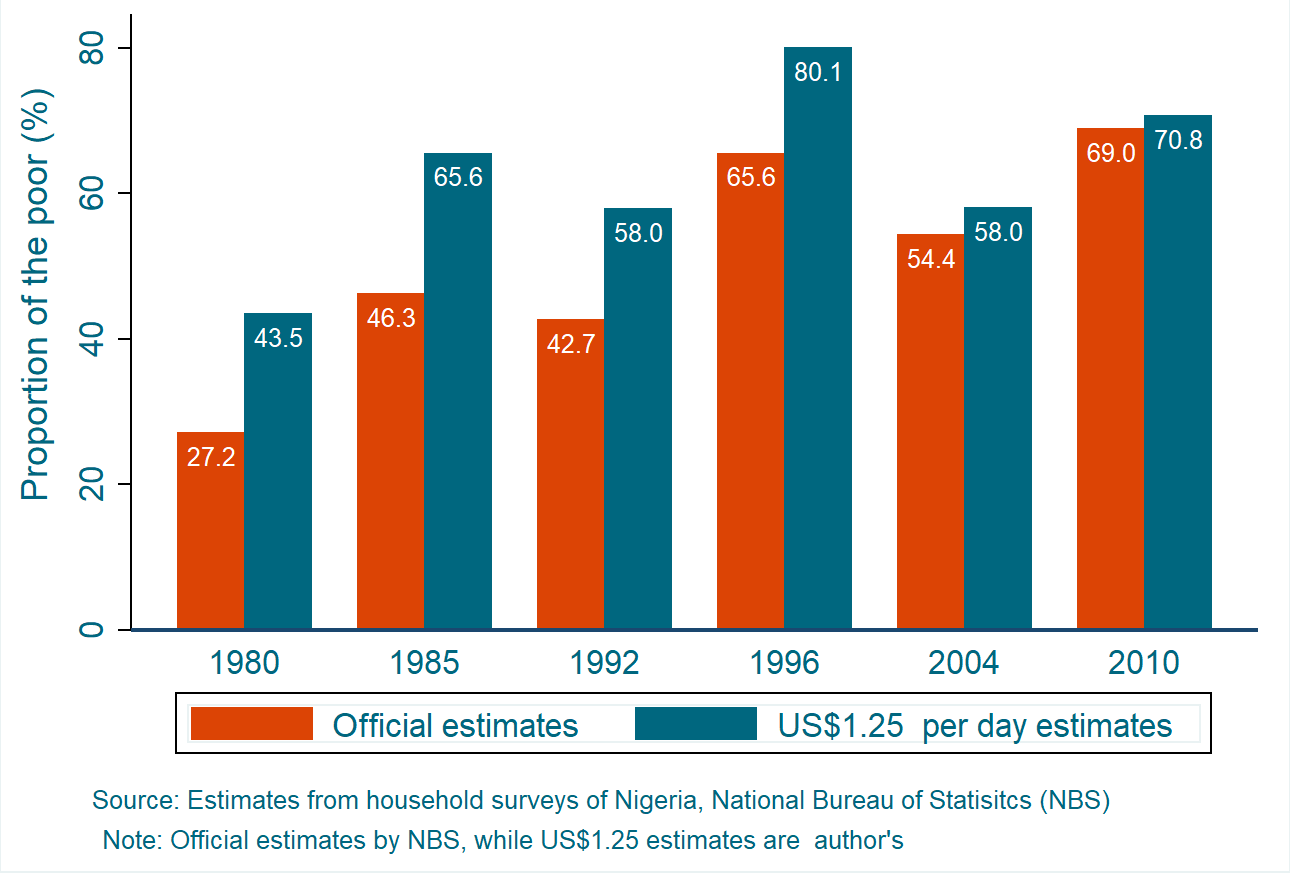
Figure 2. Poverty in Nigeria by region, 1980–2010
In a recent private conversation about what can be done to reduce poverty “in the North, Florida-based professor Kyesmu Pius—who has extensive knowledge of the region’s history—said:
“Create an enabling environment (good roads, security, 24/7 electricity) and the North will supply the entire African continent and beyond with agricultural produce. Thus, increased internally generated revenue (IGR).
Before looking at possible solutions, let us plough through the stylized fact on the poverty situation in both regions and, perhaps, try to understand the likely source of the disparities.
There are several factors that could account for this dichotomy. A deeply researched empirical academic paper on the subject might reveal a more precise answer, but even such research would potentially be constrained by lack of state-level time series data—spanning decades—on development indicators and other correlates of poverty.
A note on the poverty line
To move forward, we need a poverty line. In monitoring progress against poverty, the World Bank uses an absolute poverty line of $1.25 USD per person per day (equivalent to 317.31 Naira in today’s value). As of 2010, 7 out of 10 Nigerians were considered poor by this standard.
Possible explanations for Nigeria’s poverty divide
1. The gap showed up after…
- democracy was overturned and followed by the reign of three military juntas until 1999—and the heads of these juntas came from the North.
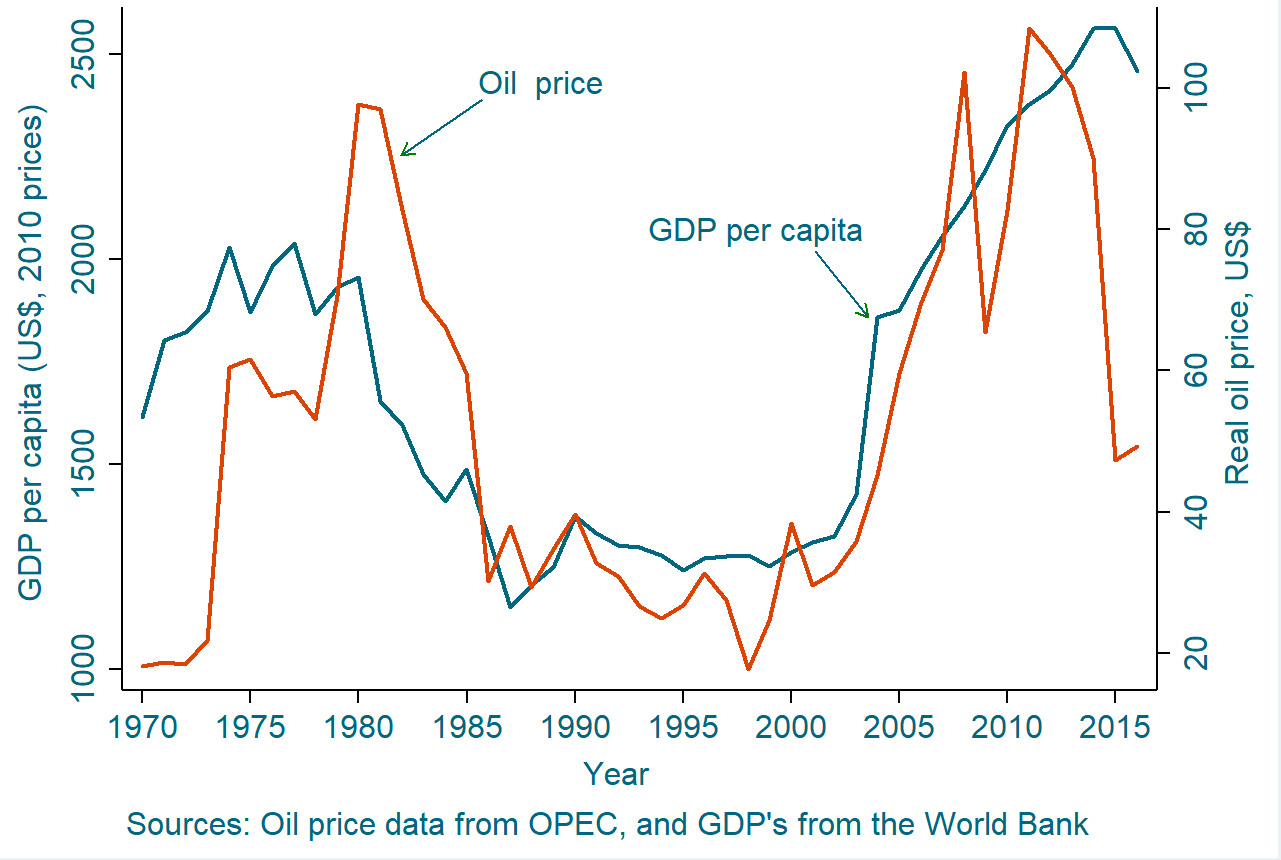
- the 1980s collapse in world oil price. Evidence in Figure 3 shows that oil price and average living standards have, over the past several decades, been moving in the same direction. Perhaps the North was benefiting more from oil proceeds as leaders from the region have held the reins of power and have as well been the determining captains and players of commerce and industry.
Figure 3.Real oil price and GDP per capita in Nigeria, 1970–2016
As Oxford’s David Bevan and others have argued:
“Why does the south benefit more than the north? It may be because the government, flush with oil rents, increases demand for service-sector industries in the south. But that story seems unlikely: after all, for long periods of the time under investigation the north was politically dominant. If any region was going to benefit from government largesse, it would be the north. The explanation could instead be to do with how northern elites used oil revenue:
the North-South divide widened during the 1960s and 1970s despite the political dominance of the North. The latter's growing economic inferiority may have been at the root of the reluctance of the Northern elite to rely upon market mechanisms or to relinquish control over the distribution of oil revenue (David Bevan et al. 1999).”
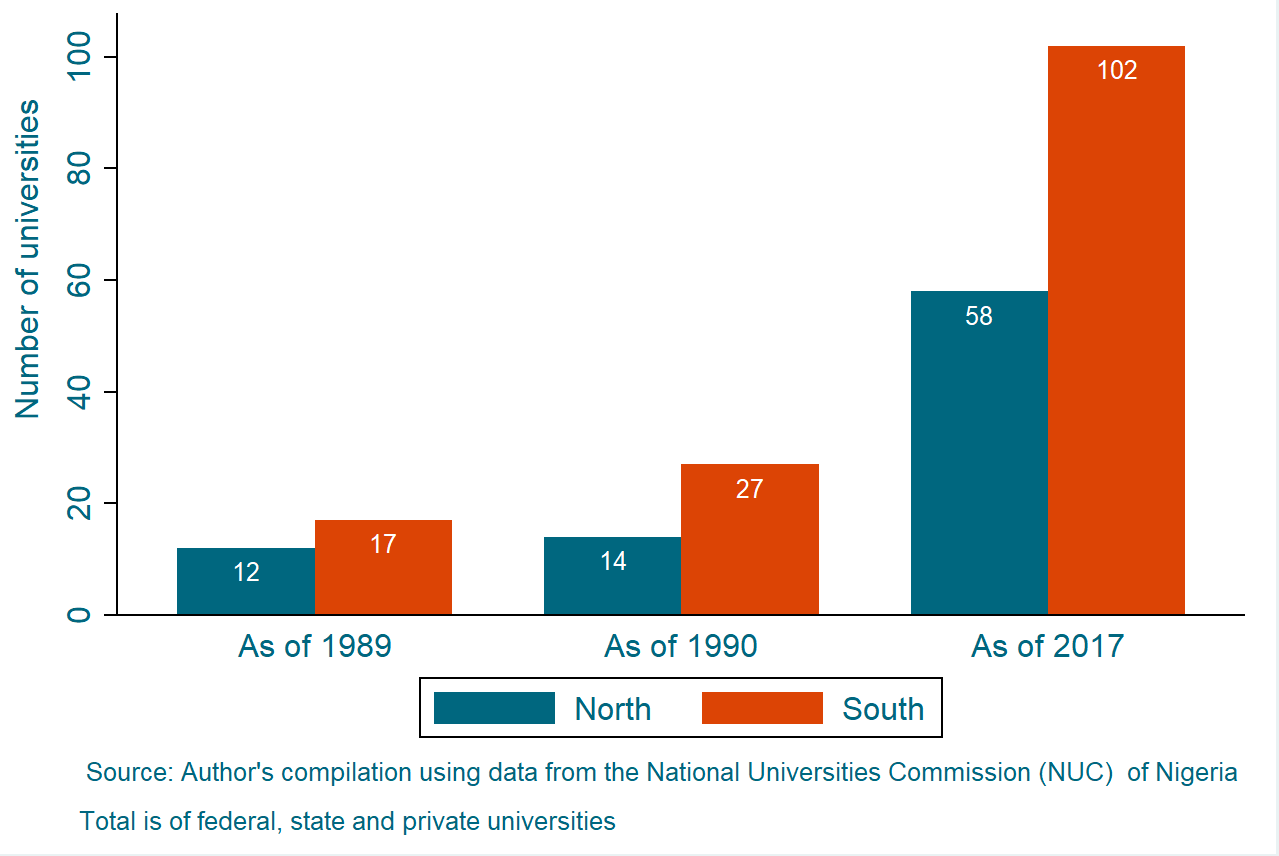
2. There are more universities in the South than in the North (see Figure 4)
Adult literacy rate is commonly recognized as key to raising living standards for the next generation. Also, an on-the-ground skilled workforce can lure investment. The North is currently disadvantaged in this respect.
The gap in the number of universities sharpened after 1999 because of the proliferation of private universities in the South. Only four private universities are in the North. The rest are government-owned. It should be noted that the North is currently experiencing a drop in registration rates at colleges.
Figure 4. Number of universities in Nigeria as of 2017
In a 1999 World Bank study, Bevan, Collier, and Gunning noted a historical fact regarding education in Nigeria:
“The gap that already existed between the South (exposed to Western-style education through mission schools) and the North (where schooling remained largely limited to Koranic teaching) widened.”
3. The North tends to spend less on its citizens than the South (see Figure 5)
However, Chinedum Nwoko, a Nigeria-based former World Bank senior economist with extensive country and international experience in budgeting, public financial management, and assessment of public procurement systems, is among many who recognize that budgets don't mean much in Nigeria. Considering actual spending would make more sense, although that has its own set of issues. So Figure 5, below, should be viewed as a commitment to development spending, and not what leaders in these states actually spent.
Figure 5. Proposed state spending per citizen and by region, 2018
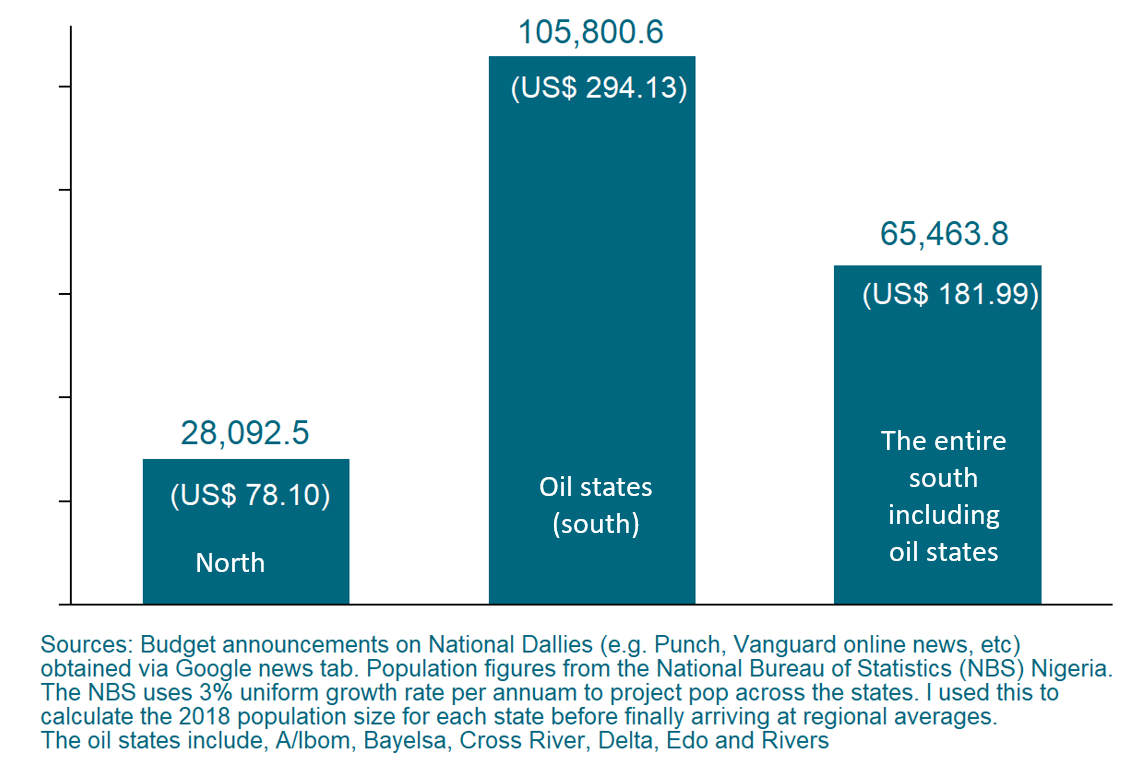
Although the North is, in terms of population size and land mass, larger than the South, the South tends to have greater availability of financial resources than the North.
For example, based on 2017 revenue figures reported by the National Bureau of Statistics, the total revenue (i.e., internally generated + federal account allocations) in only two of 17 southern states—Rivers and Lagos—is 1.03 times the size of the combined total revenue of 14 of the 19 northern states. This could be deemed a great source of disparity in poverty numbers across the regions as financial resources is indispensable in the fight against poverty.
An important caveat: this post does not intend to imply that the North has enormous financial resources but choses to spend less of it on its citizens, but rather is intended to serve as a comparative analysis. No question, oil-producing states in the South receive higher monthly federal allocations (50 percent as of 1960-69; 45 percent as of 1971-75; and 13 percent from 1999-date), and also have higher IGRs than states in the North.
4. Household size is one of the big contributors to poverty in Nigeria. The North contributes more to this.
Figure 6. Larger households contribute to rise in poverty, 2004 and 2010
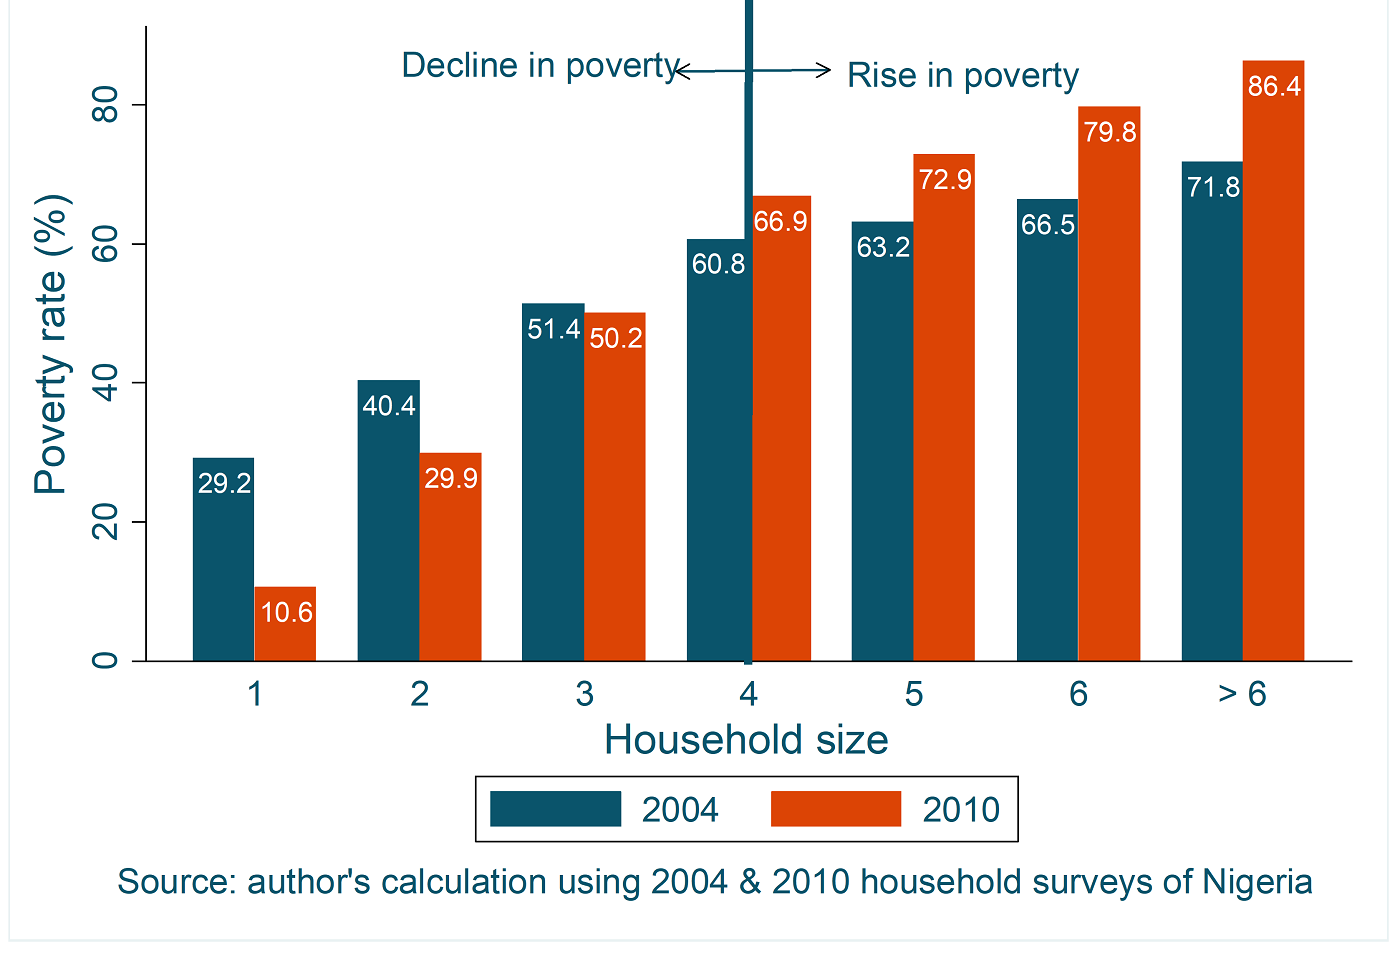
Between 2004 and 2010, the poverty rate in Nigeria rose by about 22 percent (i.e., from 58.05 percent in 2004 to 70.80 percent in 2010).
As shown in Figures 6 and 7, larger households largely drove this rise. The poverty rate among households of 1-3 persons declined, but rose among households with 4+ persons.
Figure 7. Northern states ranked highest in poverty rate and household size
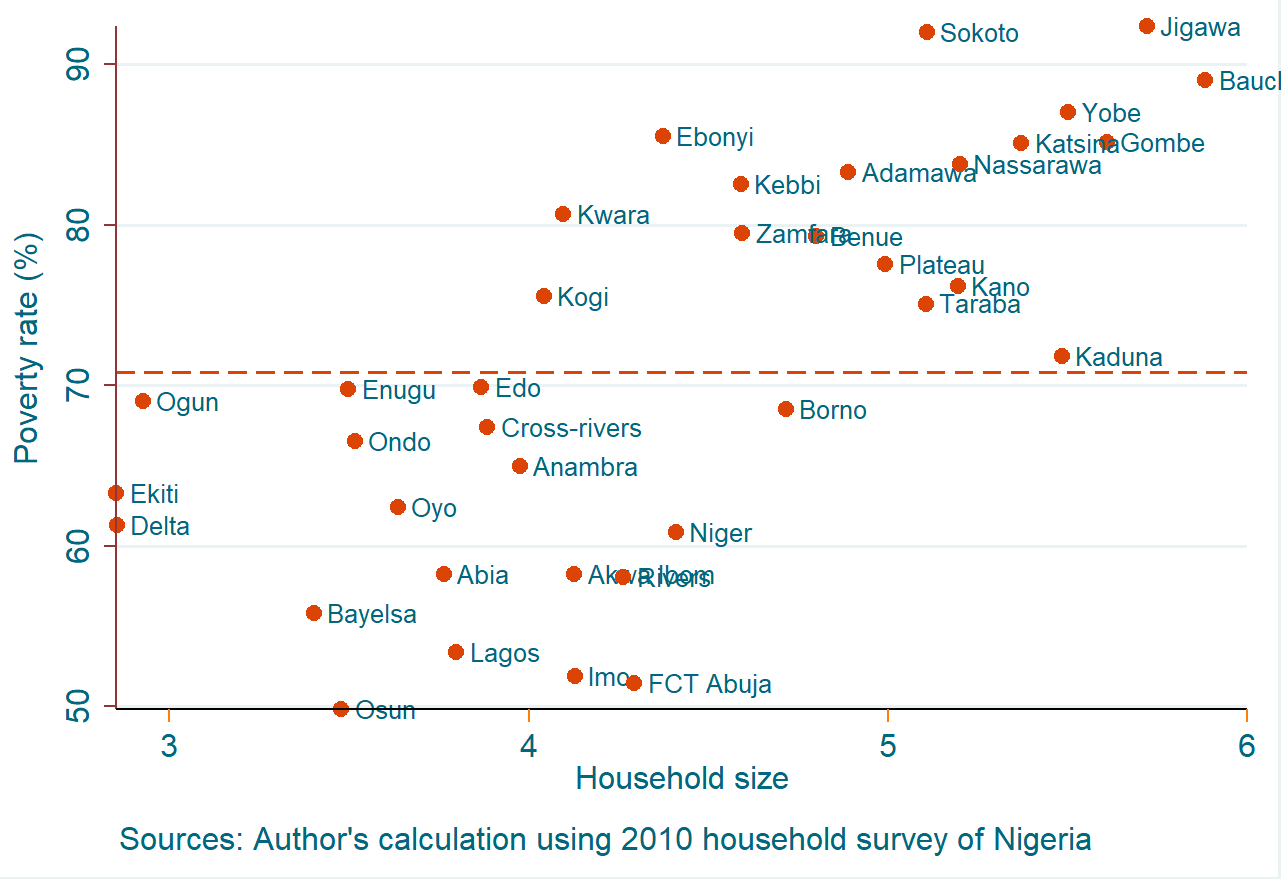
In Figure 7, the top-left and bottom-right quadrants are almost entirely empty—meaning less poverty-stricken states have smaller household sizes and vice-versa.
Top-right quadrant: States with the highest poverty rate and with the highest household size. The Jigawa state is the top in this category. All the states here have poverty rates above the national poverty rate separated by the orange-dashed line. All the states here are from the North except Ebonyi in the Southeast.
Bottom-left quadrant: States with the least contribution to poverty in the country as of 2010. The lowest poverty rate and lowest household size.
What can be done?
The challenge to policymakers to close this poverty gap does not, of course, entail transferring part of the poverty from the North to the South, but instead to focus on reducing the poverty in the North without raising the poverty rate in the South. This can be achieved by a greater effort and focus from the national government on the needs of the North. Because the North has traditionally been resistant to birth control, educating young girls may be the best option for addressing household size-induced poverty at the source; when young girls are educated they are less likely to marry and have children at a young age.
Since the North, relative to the South, lacks the financial resources required to create an environment for poverty reduction, the region clearly needs an increase in federal allocations and in infrastructure funding to attract the flow of foreign investments. But investments in the region have, since 2009, been threatened by the ongoing instability from Boko Haram militants.
But there is some hope on the horizon: the current Nigerian government—headed by a northerner—is continuing its aggressive exploration efforts for oil in the northern region that it started a few years back. It is hopeful that the discovery of oil in commercial quantities will significantly change the fortune of those living in the region. Additionally, the World Bank, in collaboration with the National Bureau of Statistics, runs regular household surveys for Nigeria. This is a potentially rich source of data that could be used in the future to study—and ultimately help bridge—the North-South poverty divide.
Disclaimer
CGD blog posts reflect the views of the authors, drawing on prior research and experience in their areas of expertise. CGD is a nonpartisan, independent organization and does not take institutional positions.