Update 12/7:
The original version of this blog post estimated that, at 81 percent treatment coverage, the doubling time of people living with HIV/AIDS would be 25 years. This estimate was derived by computing the doubling time of a stock with a compound growth rate of 2.7 percent per year, which was the calculated gap between the rate of new infections and the AIDS-related mortality rate at 81 percent coverage in the original Figure 2. However, as pointed out by Jeff Eaton in a comment to this blog, the relevant mortality rate for this calculation is all-cause mortality of people living with HIV/AIDS. Before AIDS treatment became effective, or coverage substantial, these numbers were not very different. But as AIDS treatment improves and covers more HIV-infected people, AIDS recedes as a cause of death, so that all-cause mortality substantially exceeds AIDS-related mortality. In this update, new versions of Table 1 and Figure 2 replace AIDS-related mortality with all-cause mortality. (Thanks to UNAIDS for providing these estimates by personal communication.) Projecting all countries to 81 percent coverage rate along the trends from UNAIDS’ 2015 estimates yields an estimated compound growth rate of people living with HIV/AIDS of 2.5 percent, which implies a doubling time of 28 years rather than 25 years.
In the 13 years since President Bush created PEPFAR, US funding for AIDS treatment has prevented millions of deaths, mostly in Africa. Figure 1 ranks African countries based on the percentage of their HIV-infected population on treatment in 2014. Without PEPFAR, it’s safe to say that almost all of these countries would be stuck near zero coverage, toward the left side of the graph. Instead, 49 percent of HIV-infected people were receiving life-saving treatment in 2014, rising to 56 percent by 2015. And the top-performing countries are still gaining ground: some of the countries with the highest 2014 treatment coverage were also among those with the most significant coverage expansions in 2015. This dramatic increase in treatment coverage is a prodigious achievement—and the United States deserves most of the credit. But despite these accomplishments, much more work is needed to reach the end of the epidemic.
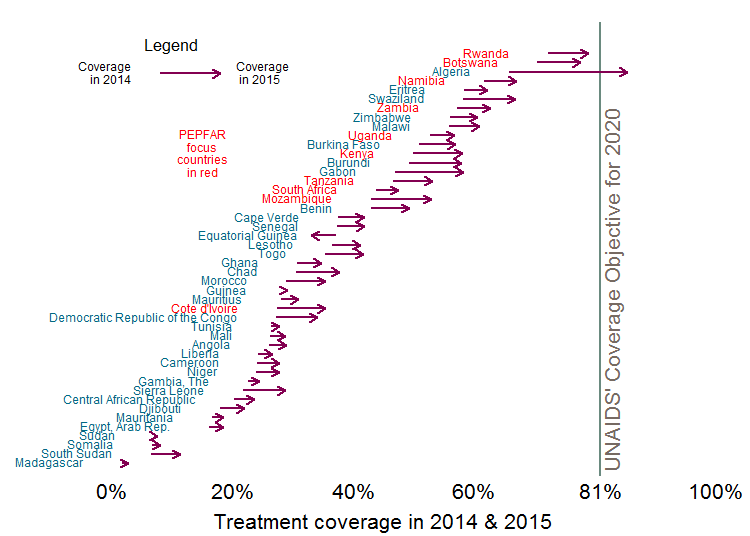 Source: aidsinfo.unaids.org accessed 11/16/2016
As I blogged in July, we will need to simultaneously reduce the death rate from AIDS and the rate of new HIV infections if we hope to one day end the epidemic. And to reduce the total number of HIV-infected persons in a country, the rate of new infections must fall below the (now reduced) rate of death from AIDS—a milestone that I’ve termed the “AIDS transition.” Since 2014, UNAIDS, PEPFAR, and the GFATM have adopted this milestone as an explicit goal. (See my 2014 World AIDS Day blog post.) But increased treatment coverage alone is unlikely to get us there.
Higher treatment coverage not only lowers the AIDS mortality rate, but also should prevent treated patients from infecting others, thereby reducing the rate of new infections. However, Figure 2 (based on the latest UNAIDS estimates) suggests that higher coverage of ARV treatment lowers mortality much faster than it lowers new infections. In fact, according to the UNAIDS estimates depicted in Figure 2, the closer a country gets to 81 percent treatment coverage, the greater the excess of new infections above mortality. In short, the gap between the two rates widens with higher treatment coverage.
Because these rates have a lower bound of zero, the divergence cannot continue at ever higher rates. Figure 2 suggests that the gap between the two rates, and thus the rate of growth of the HIV-infected population, will reach 2.5 percent, a compound growth rate, greater than the growth of many national populations, which implies a doubling of the HIV-infected population every 28 years.
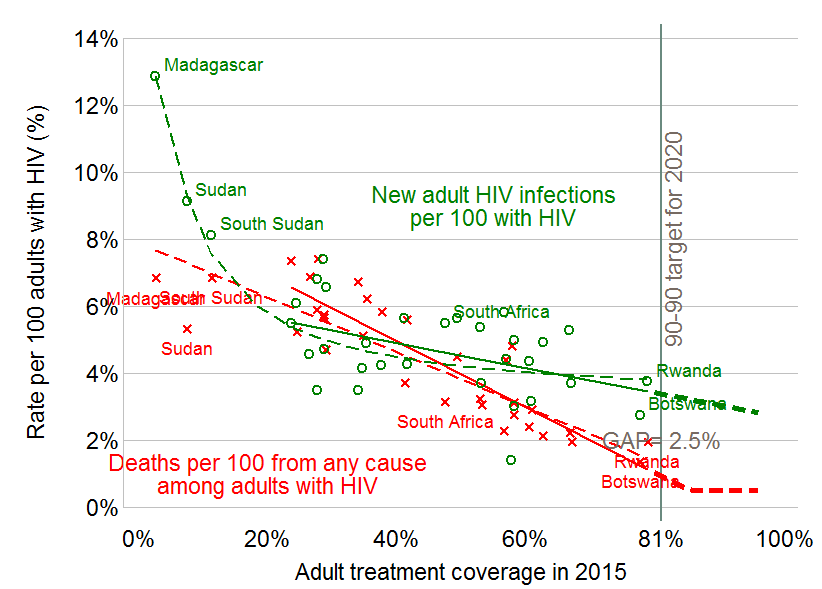 Source: Author's calculations based on UNAIDS' estimates accessed 11/16/2016. UNAIDS estimates of all-cause mortality among the HIV-infected are from a personal communication. Estimated slope of new infections is -0.04 with R2 of 0.22 and p-value of 0.0090.
Since we know from a clinical trial of exemplary rigor that a patient who adheres systematically to antiretroviral therapy has virtually zero chance of infecting others, why aren’t countries with higher treatment rates experiencing much lower rates of new infections? Why does treatment coverage explain 80 percent of the variation in mortality, but only 22 percent of the variation in the rate of new infections? Why such a weak association?
One reason the national infection rate doesn’t decline sharply with treatment is that most patients begin treatment much too late. The nature of HIV is that half of those infected feel perfectly healthy for more than eight years, and some for much longer. When they feel healthy, most people prefer to avoid the test that would reveal their HIV status or, if they test positive, prefer to postpone treatment initiation until they feel sick. This means that young people who are infected between age 17 and 24 can infect up to a dozen other people before feeling sick enough to seek treatment.
Another reason for the weak association between treatment coverage and new infections (“incidence”) is that sexual behavior is complicated. Sexual behavior varies extraordinarily within any given country, driven by a multiplicity of contextual factors, which are specific to the country or even to the local community. Cultural norms on male circumcision, condom use, girls schooling, sexual fidelity as well as national policies, active leadership, and tolerance for key populations are all candidates to explain the other 78 percent of the variation in incidence. Because society and individual behavior ultimately determine whether HIV spreads slowly or quickly, local initiatives to help vulnerable people remain healthy can be more important than any international or even national program. We have already seen examples of local initiatives to increase treatment uptake and adherence or to support sex workers’ condom use. Instead of spending all their money on top-down interventions, donors could deploy a small share of spending to provide local communities with incentives to slow transmission. In this vein, an exciting new randomized trial led by Sandi McCoy of Berkeley’s School of Public Health has found that incentives can dramatically increase treatment adherence—from 63 up to 85 percent over the first six months.
In CGD’s briefing book for the next US administration, Amanda Glassman and I made three recommendations to the US PEPFAR program which we still believe would dramatically improve PEPFAR performance and help close the gap. As described in our policy brief, we recommended that PEPFAR:
- Experiment with impact-based agreements to align policy, funding, and actions to drive progress toward an AIDS transition, with attention to rights and gender issues.
- Measure what matters—new infections and AIDS-related mortality—to achieve maximum value for spending through better targeting and alignment of financial support with countries’ own financial commitments and progress on prevention and treatment.
- Create incentives for co-financing by committing to a floor of support in hard-hit countries and developing matching funds for each additional person tested or on treatment.
Under Ambassador Birx’s dynamic leadership, we are pleased to see that PEPFAR has moved aggressively to improve measurement of what matters, including treatment adherence and new infections. But we think much more could be done to incentivize better performance by PEPFAR staff and contractors and by recipient governments. We hope PEPFAR and the incoming administration will take our recommendations to heart—and we look forward to reporting on progress on World AIDS Day 2017.
Note on the methods: The lines fitted to the scatter plots in Figure 2 are constructed from the UNAIDS 2015 regressions presented below. The sample consists of all countries in UNAIDS’ Africa and Middle East and North Africa regions with estimates for these variables except Cape Verde and Mauritius (excluded because of their small size) and Madagascar, Sudan and South Sudan (excluded as outliers due to their low coverage rates). When Madagascar, Sudan and South Sudan are included, the mortality regression represented by the dashed red line hardly changes but the incidence regression represented by the dashed green line is sharply curved and predicts an even wider gap above 81 percent coverage. In contrast to my July blog, which used last year’s UNAIDS estimates for 2014, this blog estimates the relationships for both 2014 and 2015 as they appear in UNAIDS’ 2016 estimates (accessed 11/16/2016). Using these revised and updated estimates, the quadratic term in ART coverage is not close to statistically significant in any of the four regressions, with p values ranging from 0.3 to 0.9, so I don’t show regressions with quadratic terms. As Table 1 shows, the mortality regressions are virtually identical in the two years, while the incidence regression estimate on 2015 estimates is more statistically significant, and shows a more optimistic negative association between the rate of new infections and coverage than does the regression on the 2014 estimates.
Update: In this revised version of Table 1, the dependent variables for the regressions in columns (1) and (3) are UNAIDS’ estimated all-cause mortality per 100 adults living with HIV/AIDS in that year instead of only AIDS related mortality per 100 adults living with HIV. Since all-cause mortality always exceeds AIDS related mortality in any given group, the revised constant terms are larger. Columns (2) and (4) are unchanged.
Table 1. Statistical results used to construct Figure 2
The trend lines in Figure 2 are computed based on regressions (3) and (4)
|
UNAIDS 2014 |
UNAIDS 2015 |
|||
|
Dependent variable |
Adult deaths from all causes per 100 with HIV |
New adult infections per 100 with HIV |
Adult deaths from all causes per 100 with HIV |
New adult infections per 100 with HIV |
|
Independent Variables |
(1) |
(2) |
(3) |
(4) |
|
ART Coverage |
-0.105 |
-0.03 |
-0.098 |
-0.04 |
|
(-9.82) |
(-1.86) |
(-10.5) |
(-2.8) |
|
|
Constant |
8.72 |
6.04 |
8.89 |
6.4 |
|
(18.6) |
(8.8) |
(19.1) |
(9.7) |
|
|
Sample size (N) |
30 |
30 |
30 |
30 |
|
R-squared |
0.77 |
0.11 |
0.80 |
0.22 |
|
F-value for regression |
96.42 |
3.48 |
109.4 |
7.88 |
|
p-value for regression |
0 |
0.07 |
0 |
0.01 |
Values in parentheses are t-statistics. Source: Author’s computations using UNAIDS’ AIDSInfo estimates base (accessed 11/16/2016). The author is grateful to UNAIDS for providing their all-cause mortality estimates by personal communication.
Disclaimer
CGD blog posts reflect the views of the authors, drawing on prior research and experience in their areas of expertise. CGD is a nonpartisan, independent organization and does not take institutional positions.