This is a joint post with Yuna Sakuma.
The majority of the world’s sick live in middle-income countries (MIC) – mainly Pakistan, India, Nigeria, China and Indonesia (or PINCI), according to new data from the Institute for Health Metrics and Evaluation (IHME) at the University of Washington. Sound familiar? Andy Sumner, Denizhan Duran, and I came to the same conclusion in a 2011 paper, but we used 2004 disease burden data, which didn’t provide an up-to-date view of reality. So I was pleased to see that our findings still hold based on IHME’s 2010 Global Burden of Disease (GBD) estimates.
Here is what the new (and old) data show:
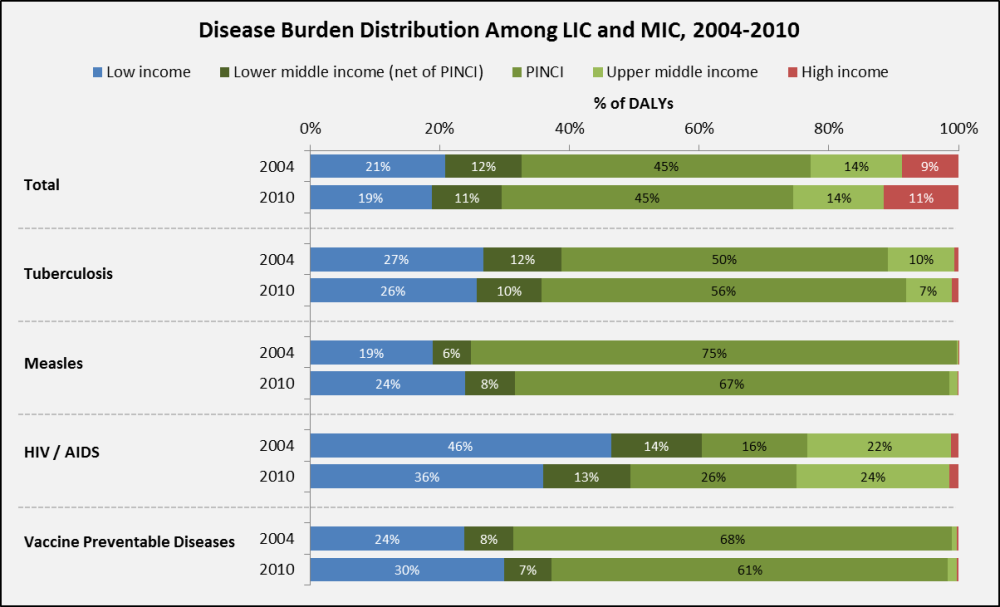
- Total global disease burden is concentrated in middle-incomes. Together, they also have the greatest disease burden associated with some of the diseases that are donor favorites: tuberculosis, measles, HIV/AIDS, and vaccine preventable diseases (see graph below). Among the MIC, disease burden is largely concentrated in PINCI, where the burden of tuberculosis and HIV/AIDS has increased from 2004 to 2010.
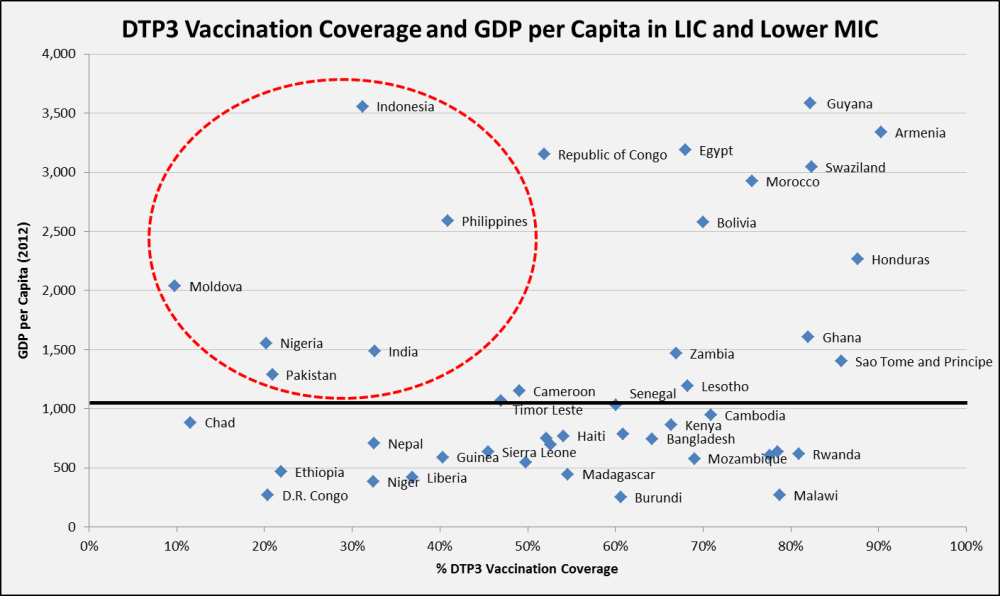
- The shift of disease burden to MIC is driven primarily by three things: income growth, population momentum and lagging efforts on public health prevention programs. More countries are growing wealthier, crossing the arbitrary line between LIC and MIC; the only problem is that the line has implications for eligibility and allocation of global resources for health. Middle income countries are also home to five of the world’s seven billion people – about three billion of which are in PINCI alone – and the absolute number of people is growing faster in these countries than anywhere else in the world. Finally, public health efforts to thwart easily preventable diseases haven’t kept pace with population growth. For example, PINCI have the largest raw number of diphtheria-tetanus-pertussis (DTP3) unvaccinated children, and as seen in the graph below, MIC have lower DTP3 coverage relative to other countries with similar or lower income per capita .
While these new data don’t necessarily tell a new story, they still herald important implications for the way global health donors allocate resources and focus efforts moving forward. If global health funders care about having the greatest possible impact on disease at the lowest possible cost, a new, tailored MIC strategy needs to be developed. We recommend:
- Eliminate income thresholds as an across-the-board eligibility criteria, and work in new ways in poorer regions in populous MIC
- Set up regional pooled or coordinated procurement schemes as at PAHO, or create a MIC window at GAVI/UNICEF, that would allow MIC to access a lower MIC-specific price for their public sectors
- Build on and expand the Medicines Patent Pool to allow for generic manufacture of key products
- Build evidence-based priority-setting institutions in MIC
- Establish better measurement and accountability mechanisms
With hope, these and others steps will leverage health aid to work in the places that need it most – middle-incomes where people’s health is falling behind economic prosperity.
Disclaimer
CGD blog posts reflect the views of the authors, drawing on prior research and experience in their areas of expertise. CGD is a nonpartisan, independent organization and does not take institutional positions.