Slogans like "Learning for all" and "Let girls learn" sit awkwardly with the reality that nobody's actually bothering to check if most of the world's girls are learning or not. International learning assessments like PISA, TIMSS, or PIRLS exclude over 90% of the worlds' kids from the sampling frame, and test precisely 0% of kids in low-income countries.
As part of our research for the International Commission on Financing Global Education Opportunity my colleagues Lant Pritchett, Mari Oye and I tried to devise a way to measure the quality of education around the world based on already existing data from the Demographic and Health Surveys, with a particular focus on girls. Here's a snapshot for 53 developing countries.
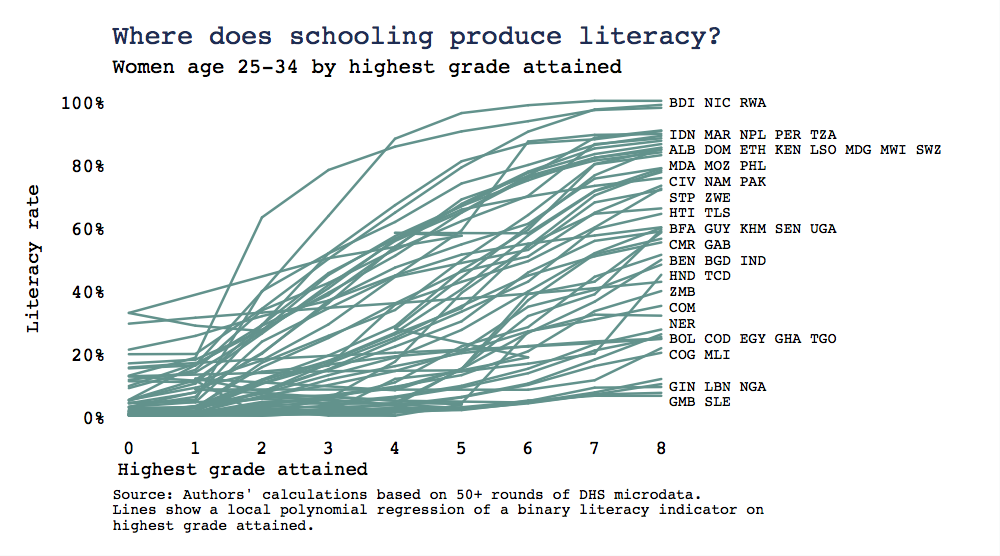
We refer to these squiggly lines as "learning profiles." They tell you not only how many women can read, but how literacy increases with years of schooling. They reveal some startlingly disparities.
- In half of the countries with comparable data, the majority of adult women who completed four to six years of primary school remain illiterate, in the sense of not being able to read a single sentence. They went to school for several years and learned approximately nothing.
- In just a handful of countries, going to schools for at least four or five years is essentially a perfect guarantee of basic literacy.
As UNESCO has noted these numbers are depressingly low overall. The gaps between countries are also eye-popping. To pick two examples, In Tanzania 57% of women between 25 and 34 years old who reported fifth-grade as their highest educational attainment could read a sentence. In Ghana, that same number was 3%. Essentially, a year of schooling in Tanzania seems to raise your chances of literacy by nearly twenty-times as much as a year of schooling in Ghana. Should we believe that, and if so, what does it mean for Ghanaian education?
Measuring education quality with literacy data
The Demographic and Health Surveys (DHS) underlying these numbers are one of the most comparable data sources on living standards in the developing world. As the name implies, the standard DHS questionnaire focuses on reproductive and child health. But in over 100 surveys spanning more than 50 countries, DHS enumerators also administered a very basic literacy test to the women answering the survey. In these surveys, the interviewer shows the respondent a card with a simple sentence in a language of her choice, and asks her to read it. See this UNESCO report for some slightly different calculations using the same data.
So how does this literacy data constitute a measure of school quality?
Clearly, literacy depends on a lot of factors. Holding quality constant, the quantity of education in the country clearly matters, as do myriad other social and economic factors. A common albeit imperfect way to begin separating the effect of schools from these broader contextual factors is to focus on value added, i.e. the additional learning associated with an additional year of schooling.
While we don't have longitudinal data on a given girl, the DHS has an advantage over many school-based tests because it administers its literacy module to a broad swath of women, some of whom never attended schools, and others who studied for several years. So we can compare women with, say, zero versus three, four, or five years of schooling in the same country and even same sub-national region. Furthermore, unlike many global statistics on literacy which are based on census data, these are not self-reported figures, but actual literacy tests. So their reliability is likely much higher.
Even in a blog post, some methodological health warnings are also in order. In some countries, the number of adult women with just, say, one year of schooling is a tiny fraction of the population. To address this, we smooth the data in the figure above using a simple local polynomial regression of literacy on years of schooling, separately for each of the 53 countries in the sample, which helps overcome the noisiness of estimates based on small samples.
More problematic than the size of the samples is their self selection: girls don't choose when to drop out of school at random. Furthermore, the analysis here is limited to women with primary schooling or less, as DHS automatically assumes women are literate if they went on to secondary school. (Given our results here, this assumption seems quite optimistic!) So we face a standard problem of causal inference: women who get more schooling were probably more academically inclined to begin with, and the slope of these lines is unlikely to be a pure causal return to school. (In most cases though, researchers assume this type of bias leads to an over-estimate of the return to schooling, which is pretty depressing given the numbers in these graphs.)
Trends: the quantity of schooling is rising; quality not so much
Looking at trends over time, it is almost certain that female literacy rates are improving. We don't have data to measure this reliably because DHS doesn't test women who reached secondary school, but even where learning levels are low—in Gambia or Sierra Leone, for instance—the trajectory is still slightly upward. More girls finishing primary school should imply more literate women.
It is less clear that literacy is improving over time due to any improvement in school quality, however. As the number of girls completing primary school has expanded, the literacy rates for those left behind has been fairly stagnant.
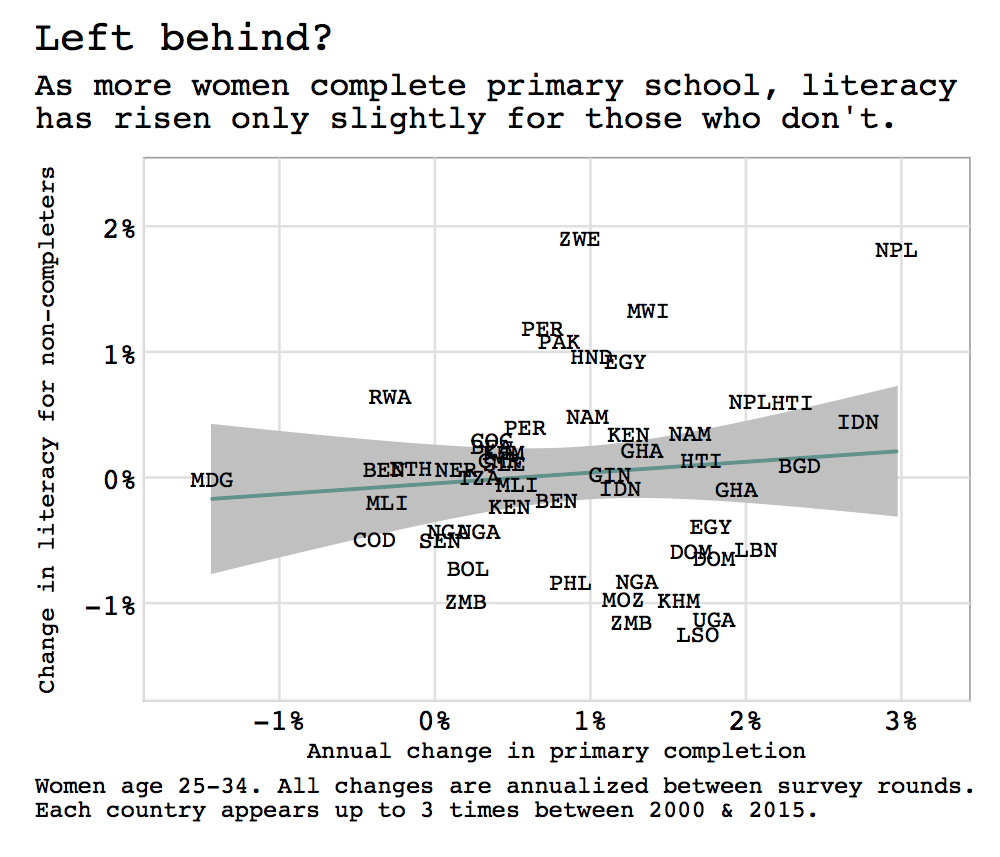
Looking at the graph, most countries are to the right of zero, implying they've made progress in girls' primary completion since 2000. But if you look at the vertical axis, you'll see countries fairly evenly spread around zero, and a nearly flat regression line, implying they've made little to no progress on raising basic literacy for women who don't finish primary school.
In short, the data we have imply that the quality of girls' schooling in much of the world is very low: millions of women have spent multiple years in school and emerged unable to read a simple sentence. Furthermore, it's not getting much better over time.
The economic and social implications here are potentially massive. Since girls' schooling is associated with so many positive outcomes in development—from greater female autonomy to lower child mortality—it is reasonable to wonder whether low literacy gains are undermining these social returns schooling, or whether schooling alone is sufficient. That's a question we'll be looking at in a forthcoming background paper for the Commission. In the meantime, inasmuch as we care about learning per se and the lofty education targets in the UN's Sustainable Development Goals, it's clear that our baseline for delivering real learning to every girl and boy is extremely low.
All data used in the analysis here is freely available from the DHS website (registration required). For transparency, we are also posting our Stata programs to combine DHS datasets and make the graphs shown above. Lastly, full results by country for literacy by highest grade attained (without the local polynomial smoothing in the graphs) is shown below.
|
Adult female literacy by highest grade attained
|
|||||||||
|
Country |
None |
1st |
2nd |
3rd |
4th |
5th |
6th |
7th |
8th |
|
Honduras |
7 |
38 |
65 |
||||||
|
Nicaragua |
1 |
29 |
52 |
64 |
70 |
45 |
87 |
||
|
Nepal |
11 |
32 |
47 |
69 |
80 |
92 |
|||
|
Morocco |
4 |
32 |
47 |
65 |
86 |
88 |
|||
|
Burundi |
21 |
25 |
40 |
62 |
85 |
95 |
99 |
||
|
Rwanda |
6 |
15 |
35 |
62 |
86 |
93 |
97 |
99 |
98 |
|
Moldova |
2 |
15 |
40 |
62 |
82 |
86 |
|||
|
Pakistan |
3 |
31 |
51 |
57 |
74 |
||||
|
Peru |
3 |
14 |
29 |
55 |
69 |
81 |
90 |
||
|
Dominican Republic |
5 |
13 |
27 |
50 |
75 |
79 |
87 |
88 |
92 |
|
Lesotho |
3 |
55 |
58 |
76 |
82 |
92 |
|||
|
Indonesia |
7 |
22 |
33 |
44 |
70 |
73 |
91 |
||
|
Namibia |
10 |
24 |
27 |
43 |
55 |
64 |
69 |
78 |
65 |
|
Philippines |
2 |
19 |
28 |
50 |
64 |
70 |
83 |
||
|
Tanzania |
2 |
13 |
17 |
36 |
51 |
57 |
74 |
89 |
99 |
|
Malawi |
2 |
7 |
19 |
37 |
61 |
70 |
82 |
88 |
92 |
|
Cote d'Ivoire |
2 |
11 |
26 |
51 |
65 |
81 |
|||
|
Sao Tome & Principe |
23 |
54 |
68 |
82 |
|||||
|
Ethiopia |
1 |
14 |
20 |
32 |
47 |
63 |
79 |
75 |
93 |
|
Cambodia |
1 |
7 |
14 |
27 |
46 |
65 |
76 |
||
|
Haiti |
1 |
9 |
18 |
27 |
45 |
60 |
71 |
||
|
Mozambique |
0 |
2 |
4 |
16 |
42 |
61 |
83 |
86 |
|
|
Gabon |
1 |
5 |
12 |
31 |
55 |
71 |
|||
|
Bangladesh |
1 |
4 |
8 |
18 |
36 |
54 |
|||
|
Swaziland |
17 |
68 |
82 |
86 |
|||||
|
Zimbabwe |
11 |
12 |
31 |
45 |
36 |
57 |
68 |
||
|
Kenya |
2 |
13 |
17 |
25 |
32 |
43 |
64 |
74 |
87 |
|
Uganda |
2 |
1 |
10 |
20 |
36 |
49 |
61 |
78 |
|
|
Timor |
1 |
9 |
24 |
34 |
46 |
66 |
|||
|
Cameroon |
1 |
1 |
2 |
11 |
17 |
46 |
62 |
48 |
|
|
Senegal |
1 |
4 |
3 |
4 |
16 |
46 |
65 |
||
|
Benin |
0 |
4 |
2 |
8 |
17 |
43 |
57 |
||
|
Burkina Faso |
0 |
6 |
4 |
12 |
35 |
53 |
|||
|
Guyana |
62 |
||||||||
|
Comoros |
1 |
12 |
29 |
39 |
82 |
||||
|
Zambia |
1 |
5 |
6 |
6 |
14 |
20 |
37 |
54 |
|
|
Albania |
87 |
||||||||
|
India |
1 |
10 |
15 |
21 |
33 |
48 |
|||
|
Bolivia |
4 |
18 |
33 |
||||||
|
DRC |
0 |
1 |
3 |
6 |
17 |
25 |
36 |
||
|
Egypt |
2 |
6 |
6 |
9 |
16 |
20 |
31 |
||
|
Togo |
0 |
7 |
4 |
5 |
9 |
19 |
33 |
||
|
Congo |
2 |
7 |
15 |
33 |
|||||
|
Mali |
0 |
1 |
1 |
1 |
8 |
14 |
34 |
||
|
Lebanon |
0 |
0 |
2 |
0 |
5 |
11 |
30 |
||
|
Chad |
0 |
0 |
8 |
13 |
|||||
|
Nigeria |
0 |
2 |
1 |
4 |
6 |
8 |
13 |
13 |
|
|
Guinea |
0 |
3 |
3 |
4 |
6 |
11 |
|||
|
Gambia |
0 |
5 |
1 |
8 |
7 |
||||
|
Sierra Leone |
0 |
2 |
3 |
1 |
4 |
5 |
|||
|
Ghana |
0 |
3 |
1 |
2 |
3 |
7 |
|||
|
Source: Authors' calculations based on all available DHS rounds since 2000. |
|||||||||
|
Countries are ranked by the earliest grade at which at least 50% of women are literate. |
|||||||||
|
Literacy tests are only administered for women with incomplete primary, thus the highest grade varies by country. Missing cells have fewer than 50 observations and were excluded. |
|||||||||
Disclaimer
CGD blog posts reflect the views of the authors, drawing on prior research and experience in their areas of expertise. CGD is a nonpartisan, independent organization and does not take institutional positions.