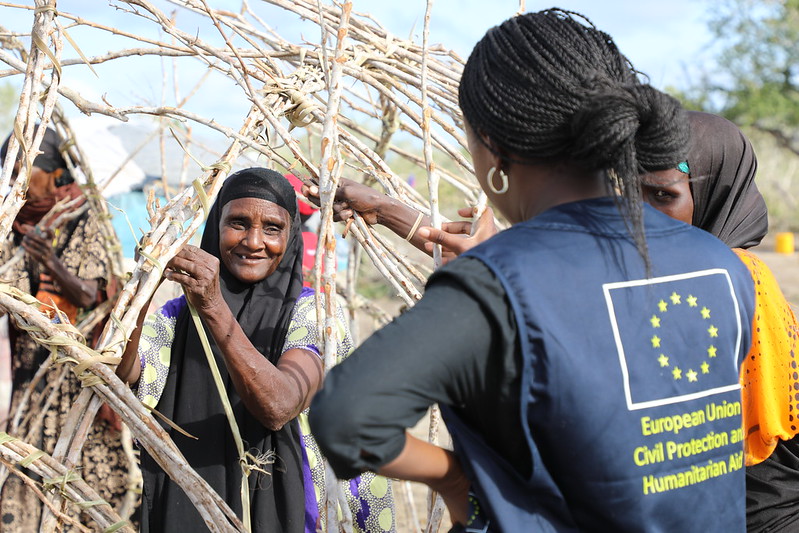
What do you picture when you hear ‘humanitarian aid’?
Most of us imagine temporary shelter to help people get back on their feet after a natural disaster, or food supplies and clothing to help refugees for a few weeks after they’ve fled a conflict. Those images are increasingly out of touch with what’s happening on the ground.
Emergencies are more protracted: a girl born in Kenya’s Dadaab refugee camp the year it was founded would be well over 20 years old today and could still be living there. Last year, two-thirds of official humanitarian assistance went to long-term recipients. That’s putting humanitarian budgets under strain. According to the UN, the number of people in need of help has doubled in the last decade; humanitarian aid grew by less than half.
There’s a growing consensus that humanitarian cash transfers can help to bridge the widening gap between needs and resources, empowering people affected by disaster and using local markets to deliver the goods and services we previously thought only aid agencies could provide.
What we know about humanitarian cash transfers
The Cash Atlas, a platform to help track how and where cash transfers are being deployed, can add some context to our understanding of the current state of cash transfers. The data are self-reported by agencies and so not a comprehensive record. Nevertheless, focusing on the years 2005 to 2014, the Cash Atlas includes nearly 800 programs implemented by 49 different organisations.
We combine information about transfers with financing data from OCHA’s financial tracking service, convert figures to today’s prices, and allocate budgets equally over each project’s duration to estimate spending per year. The resulting data represents $2.8 billion worth of cash transfer programming. (Click here to download the data appendix, .do file, and a note on methodology).
What did we learn?
1. Humanitarian needs are outstripping funding
Humanitarian agencies set out the financing they need to tackle crises using the humanitarian programme cycle (previously called the consolidated appeals process). Adding what agencies asserted they needed and comparing it to what donors funded paints a stark picture of a growing deficit between needs and resources. (Click off ‘Funding’ and ‘Requirements’ to zoom in on this growing shortfall).
It’s plausible that agencies overstate their needs. But with a deficit of over $7.3 billion last year, dissembling by humanitarians, if present, probably isn’t the main story.
2. Agencies are scaling up ‘cash-type’ transfers, but most come with conditions
Cash transfers are the Rorschach test of humanitarian aid— agencies see what they want in it. It can mean putting $60 a month on a debit card so that a family can decide what to buy (and where to get it cheaply), but is also used to describe everything from vouchers for work to cash for training.
We translate the Cash Atlas’ tags into something more intuitive by calling a transfer conditional if it requires the recipient to do something (‘cash for training’, ‘cash for work’, and ‘conditional grants’), unconditional if it’s described as such (‘unconditional grant’), and a voucher if people can only spend it in specific ways (‘vouchers’, or ‘vouchers for work’).
Breaking the data down like this shows that organisations have mainly used programs that come with strings attached for beneficiaries. However, this buries an interesting lead: unconditional transfers are growing quickly, reaching about one-fifth of the total estimated budget for cash programs last year.
3. Cash is still a tiny share of humanitarian aid
What does this rise in cash programming look like in context? A reasonable comparator is how much donors spend on humanitarian aid more broadly (appeals, together with various kinds of emergency funding and bilateral aid).
OCHA’s data indicate that donors spent $23 billion on humanitarian aid last year. On a purely fiscal basis, then, cash-type interventions remain the unloved country cousins of humanitarian response, accounting for less than $1 billion of this. (Zoom in by clicking on the legend to see how cash programming has grown over time but remains a very small share humanitarian spending).
4. Most programs haven’t been (only) about transferring cash.
Our data show very few examples of ‘pure form’ programs: a budget line that only pays for beneficiaries to receive modest payments and lets them decide how to spend them. Leaving out reports that don’t flag which of these types of budget it was or which ‘modality’ was used leaves 368 programs. Of these, just 22 — less than six in every hundred — fit this description.
| Type of transfer | ||||
| Unconditional | Conditional | Voucher | ||
| Type of program | Cash only | 22 | 51 | 54 |
| Cash / in-kind | 88 | 96 | 57 | |
A more inclusive definition could include programs that gave unconditional grants irrespective of whether their budgets included in-kind aid. That brings the total up to 110, just under one-third of the total.
5. Most budgets haven’t been (only) about transferring cash.
A head count of programs based only on whether they include in-kind aid is instructive, but isn’t weighted by how much agencies actually spend. It might be, for example, that a small number of unrestricted transfers actually represents a very large share of humanitarian cash programming.
The 368 programs about which we know both the type of budget and how the cash transfer was made represent $750 million (of the $2.8 billion) worth of programs included in the Cash Atlas. Of this, less than 5 percent, nearly $37 million, is for ‘cash only’ programs that delivered unconditional transfers.
However restrictive the definition, and regardless of whether we’re looking at the number of programs or weighting them by spending on each, it seems that agencies haven’t comprehensively moved to large-scale, unconditional programs, or separated those programs from traditional, in-kind aid.
6. Most beneficiaries don’t (only) experience cash.
Though it’s easy to focus on top-line budgets, what ultimately matters is the number of people a program benefits. Combining information about the total budgets with the number of ‘beneficiaries’ that agencies purport to reach picks up some interesting trends.
Most importantly, this shows that larger budgets aren’t coupled to coverage. The size of the spheres indicates that voucher-based programs reach the most people, but have consistently received a smaller share of total budgets. Similarly, in the last few years fewer people benefited from conditional than unconditional programs (1.48 million vs. 1.54 million), but the graph shows that conditional transfers had larger budgets: $234 million more in 2014.
What we don’t know, but should
7. Budgets per person vary a lot, and we don’t really know what that means.
Comparing budgets to the number of beneficiaries begs the question of what this looks like on a per-person basis. Since our data are in current (2015) terms, we get a ‘budget per capita’ by adding up cash programming budgets over the last decade and dividing by the number of beneficiaries that aid agencies report assisting.
The concept of ‘budgets per capita’ highlights a fundamental gap in what we know about HCTs.
People who are skeptical about ‘cash for training’ can point out how expensive those programs are. But organizations delivering training programs might point to the same number and argue that, no, this actually shows much value they transfer to beneficiaries. In short, budgets aren’t the same as costs. If these different modes of transfer cost the same to make, ‘cash for training’ might well pass on the most to those we’re focused on helping.
But even if we took these numbers at face value, and even if we assumed (without basis) that they cost the same, we still couldn’t make a value judgment about what donors should focus on. Transferring $60 dollars to a family, for example, might help them get what they most need by making tough choices between heating, school fees, or clothing. That could ultimately be much more ‘valuable’ than other interventions that cost as much, or much more
* * *
CGD has been working with the Overseas Development Institute to look into humanitarian cash transfers, supporting a High-Level Panel on Humanitarian Cash Transfers chaired by my colleague Owen Barder. The panel will launch its report on September 14. Its findings reflect decades of hard-won, front-line experience, opportunities arising from new ways to transfer money safely and securely, and insights from a fast-growing evidence base.
Data-driven initiatives like the Cash Atlas are an important start to understanding the role that HCTs can play. But we won’t be able to get a fix on the value added by different kinds of aid without better information, not only about budgets but also on costs and, more importantly, what those we have a duty to assist actually need, want, and can use.
This, ultimately, is why the high-level panel has been convened: to help us weigh the evidence that we have on cash transfers, and to chart a path forward for humanitarian aid that strikes an informed balance between the thorny yet critical issues of cost, value, and growing need.
Disclaimer
CGD blog posts reflect the views of the authors, drawing on prior research and experience in their areas of expertise. CGD is a nonpartisan, independent organization and does not take institutional positions.


