Each year, the Center for Global Development produces the “Commitment to Development Index” (CDI), that evaluates 40 of the most powerful countries across a range of indicators that measure their impact on developing countries. Development policy is far more than just aid, encompassing agreements that regulate interactions with developing countries, policies governing migration and capital flows, impact on the environment, and a myriad of other factors.
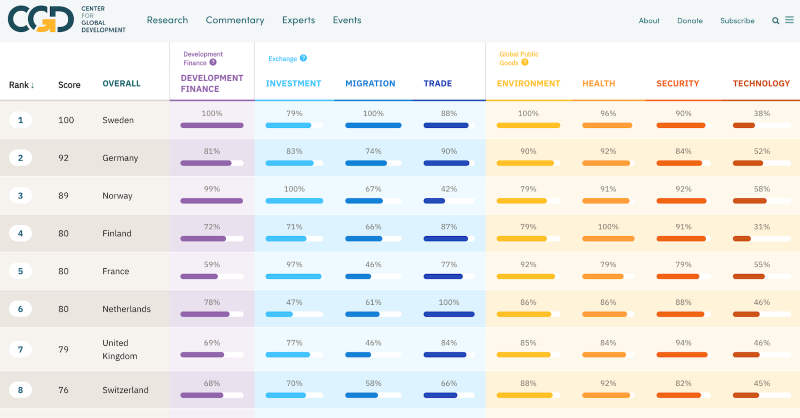
The CDI captures this diversity by assessing countries’ performance on seven components: development finance, investment policies, migration, trade, environment, security, and technology, each consisting of a suite of indicators. Together, these components provide a holistic picture of countries’ commitment to development.
Figure 1. The Commitment to Development Index

But what is the relative importance of these policies? Is it more important to give aid generously and untied, or to maintain a relaxed border policy that allows people to migrate and send remittances? The weights given to each of the seven “components” are equal (within components the authors decide on weights of the supporting indicators based on evidence of their importance). Given even weights on components are to some extent arbitrary, if a country’s rank is sensitive to the weights then it would be hard to draw firm conclusions from the index, and perhaps we shouldn’t bother aggregating performances across components. However, this short blog demonstrates that the ranking of countries in the CDI is fairly robust to the weights used. That rankings change little as weights are varied suggests that the CDI is capturing something real about the attitudes towards development of countries included in the index.
Weighting in vain*
The CDI has weighted each of seven components equally in the overall index. This is mainly for the sake of simplicity, but it also reflects the difficulty of identifying an adequate scientific basis for giving some a heavier weight than others. Many might think that the environment component is the most important and should be weighted above secondary concerns like trade, others might take the opposite view. Unless a consensus emerges about the relative importance of these components, it makes sense to have “flat priors” and assume that all are weighted equally.
But even if defensible, this does not avoid making a judgement about the weights. A relevant question is therefore how much this judgement matters. This blog explores this question via two different methods: randomly generating 1,000,000 sets of component weights and examining the set of ranks that each one produces, and calculating all permutations over a range of numbers that sum to one.
Random weights: Dirichlet distribution
The first method is to randomly generate 1,000,000 sets of random numbers that are between zero and one, and sum to one. The “Dirichlet” distribution does just that. This is a multivariate distribution, controlled by a vector of parameters of length equal to the number of weights to be generated. Two aspects of this vector are important for controlling the way in which weights are generated:
The relative value of these elements control the average value of the individual weights (so for example, a parameter vector of (1,1,1,1,1,1,2) would give the seventh weight a value twice as high as the others on average). For the CDI, our initial assumption is that all components are equally important. Therefore, we choose a vector in which all elements are equal, meaning all weights are centred around the same value of 1/7.
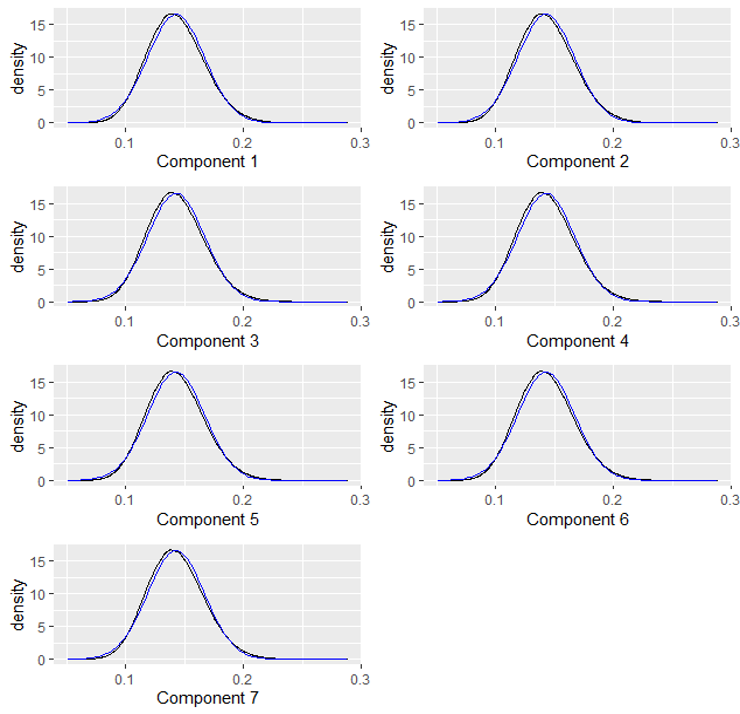
The magnitude of the vector controls both the shape of the distribution, and how tightly bunched the generated weights are around their expected value. As the magnitude of the vector elements increase, the distribution of the weights generated become closer and closer to the normal distribution, and more tightly bunched around the mean.
Figure 2 plots the distribution for each component weight generated by this distribution when each parameter is equal to 30, and compares it to the normal distribution.
Figure 2. Distribution of random weights generated by Dirichlet (against normal distribution)
Roughly, weights for each component generated by this distribution vary between 5% and 25%. Although centred around their means, some of these weight sets will be beyond what most would regard as plausible, for example, one component receiving twice the weight of all others. With these (million) sets of weights, figure 3 plots the ranks that occur in a 40 by 40 matrix, in which each square is shaded according to how many times that rank occurs. A darker square means that rank occurs more frequently. This allows us to assess where we are confident in the ranks.
Figure 3. Frequency of ranks, weights generated by Dirichlet distribution (alpha=30)
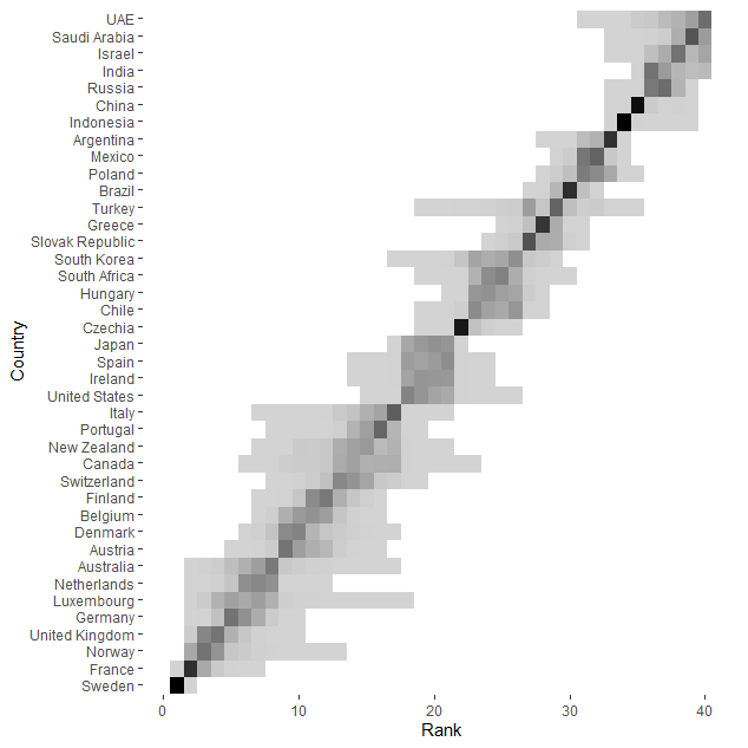
In each of the one million weight sets we generate, there are only two in which Sweden does not top the rankings: its first place is remarkably stable. We can also be fairly confident in placing France second, Czechia 22nd, and China 35th, as illustrated by the dark squares representing those ranks. Note that this is based on the data used in the CDI 2020—but if policies and data changed, rankings could alter substantially.
But figure 3 also allows us to see where there is little to choose between countries. Japan, Spain, Ireland, and the US are clearly very similar: for each country the ranks 17 to 20 occur a similar number of times, as illustrated by the larger rectangle visible around these . The same is true of Mexico and Poland (32nd and 31st), and South Korea, South Africa, Hungary, and Chile (ranks 22 to 26). For these groups of countries, differing opinions on the importance of each component will cause disagreement about rankings, contrary to the case of Sweden.
All possible permutations over a range
Generating weights randomly is not the only option. Instead, we could pick an increment (say, weights can be a multiple of 0.05) and a range (say, weights can be between 0 and 0.5) and then calculate the CDI with all possible combinations. This is computationally intensive, and will produce some truly odd sets of weights, and therefore we would expect more variation in ranks. Figure 4 shows the same 40x40 grid as in figure 2, following this exercise. In panel A, weights vary between 5 and 25 percent, and in panel B, they vary between 0 and 30 percent, with the range divided into 13 steps in each case. For example, in panel B, a feasible set of weights could be 30 percent for development finance, migration and trade, 10 percent for security, and no weight on all others.
Figure 4. Frequency of ranks,
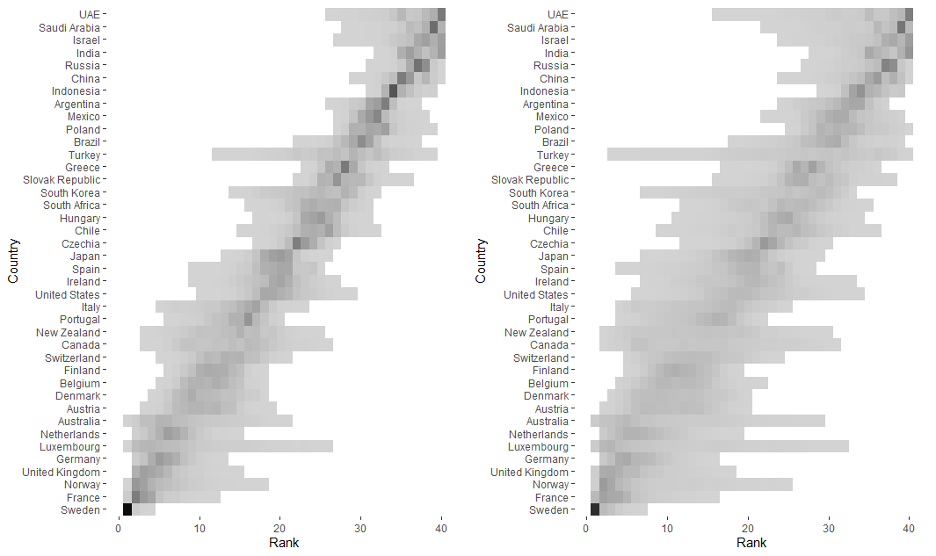
As expected, ranks are far more dispersed, and the centres of the distributions of ranks are less peaked, and the greater range of course has even lower peaks. However, one remarkable exception is Sweden. Even with weights varying between 0 and 30 percent (outside what most would consider reasonable) it always comes in the top 10. And in over three quarters of cases, it comes first place.
By contrast, Turkey’s rank varies dramatically. This can be anticipated by viewing the range of ranks across components, which is greater than for any other country. Turkey’s top rank is 2nd on the migration component, whereas it comes 38th for technology. Disagreements about the weights on these components will clearly affect people’s views on Turkey’s commitment to development more than (for example) Portugal, whose component ranks vary between 5th and 20th (on environment and trade respectively).
However, even where some may quibble over relative places of a handful of countries, this exercise reinforces the general picture. Even with weight sets many would regard as absurd, some countries are consistently behind others: for example, in the tests above, Germany always outperforms Greece, and Portugal always outperforms Poland. When weights on components vary between 0 and 30 percent, around 60 percent of the ranks produced for each country are within two places of the actual CDI rank on average.
Focus on the policies, not the weights
The CDI aims to generate discussion and help countries identify where they can improve in terms of their commitment to development. While the CDI-system of equal weights across components is a compromise that probably doesn’t reflect anyone’s views perfectly, it is defensible, and the bigger picture remains the same even with diverse sets of weights. The more important debate is how these scores can be used to help the 40 CDI countries become better global players.
Download the data and code for this blog here.
Thanks to Ian Mitchell, Charles Kenny, and Julian Duggan for valuable comments,
*Thanks to Arthur Baker for the subtitle suggestion!
Disclaimer
CGD blog posts reflect the views of the authors, drawing on prior research and experience in their areas of expertise. CGD is a nonpartisan, independent organization and does not take institutional positions.