Recommended

WORKING PAPERS
Blog Post
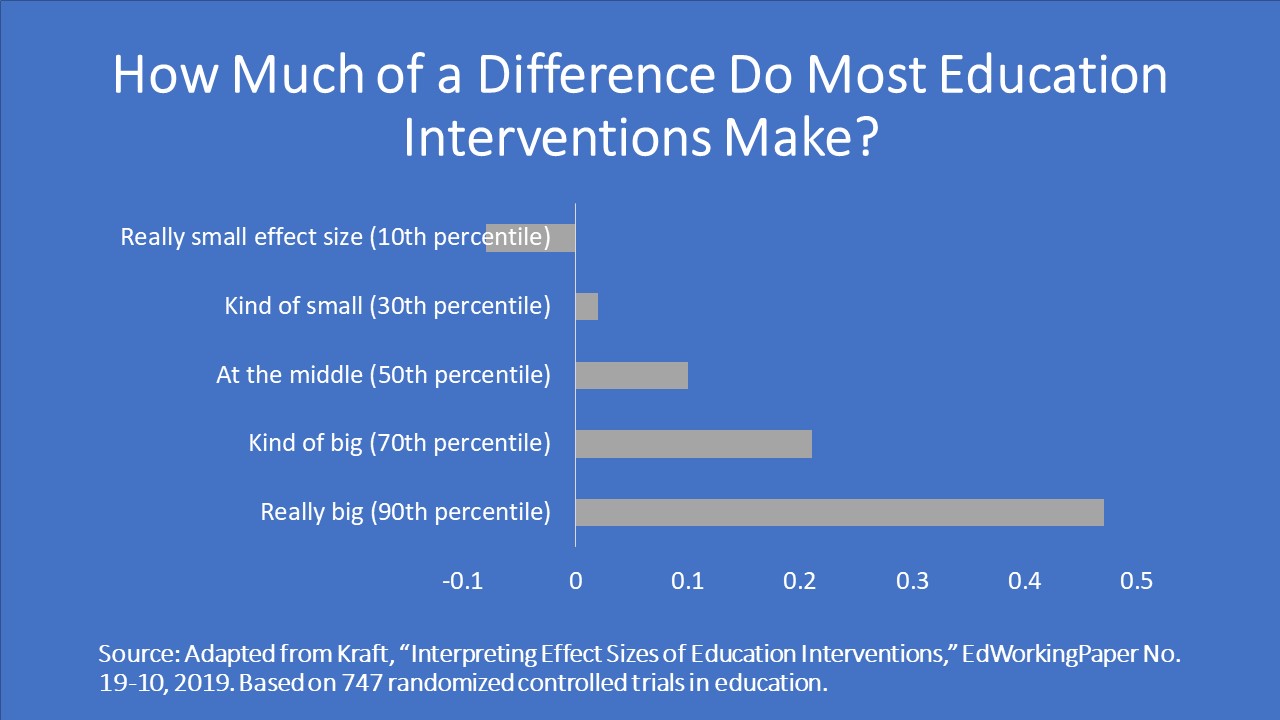
People around the world have long tried to expand the reach of education systems and improve their quality. But there are still gulfs in access and quality, both across and within countries. A steady stream of evaluations in recent decades seeks to measure how much education interventions increase access to school or improve learning at school in low- and middle-income countries. How effective are these interventions? A common rule of thumb is to say that a small effect is 0.2 standard deviations (SDs), a medium effect is 0.5 SDs, and a large effect is 0.8 SDs. But guess what? Those cut-offs, proposed by Jacob Cohen, come from a series of social psychology experiments done mostly among U.S. higher education students more than 50 years ago. How relevant are those likely to be to learning or access outcomes of education interventions in low- and middle-income countries?
What we did
Matthew Kraft, in a recently published paper, looked at the distribution of learning outcomes in randomized controlled trials (RCTs) of education interventions in high-income countries. He found a median impact of just 0.10 standard deviations and, based on dividing the effect sizes into thirds, proposed a new set of rule-of-thumb cut-offs for small (less than 0.05 SDs), medium, and large (greater than 0.20 SDs) effect sizes. (I summarized his paper in a blog post.)
In our paper—“How Big Are Effect Sizes in International Education Studies?”—we examine 138 randomized controlled trials and 96 quasi-experimental studies in low- and middle-income countries with access or learning outcomes and standardize their effect sizes. We include lots of different kinds of education interventions: new pedagogies, providing inputs, training teachers, using technology, constructing schools, and others. Then we look at the distribution to ask, how big is a big effect size?
What we learned
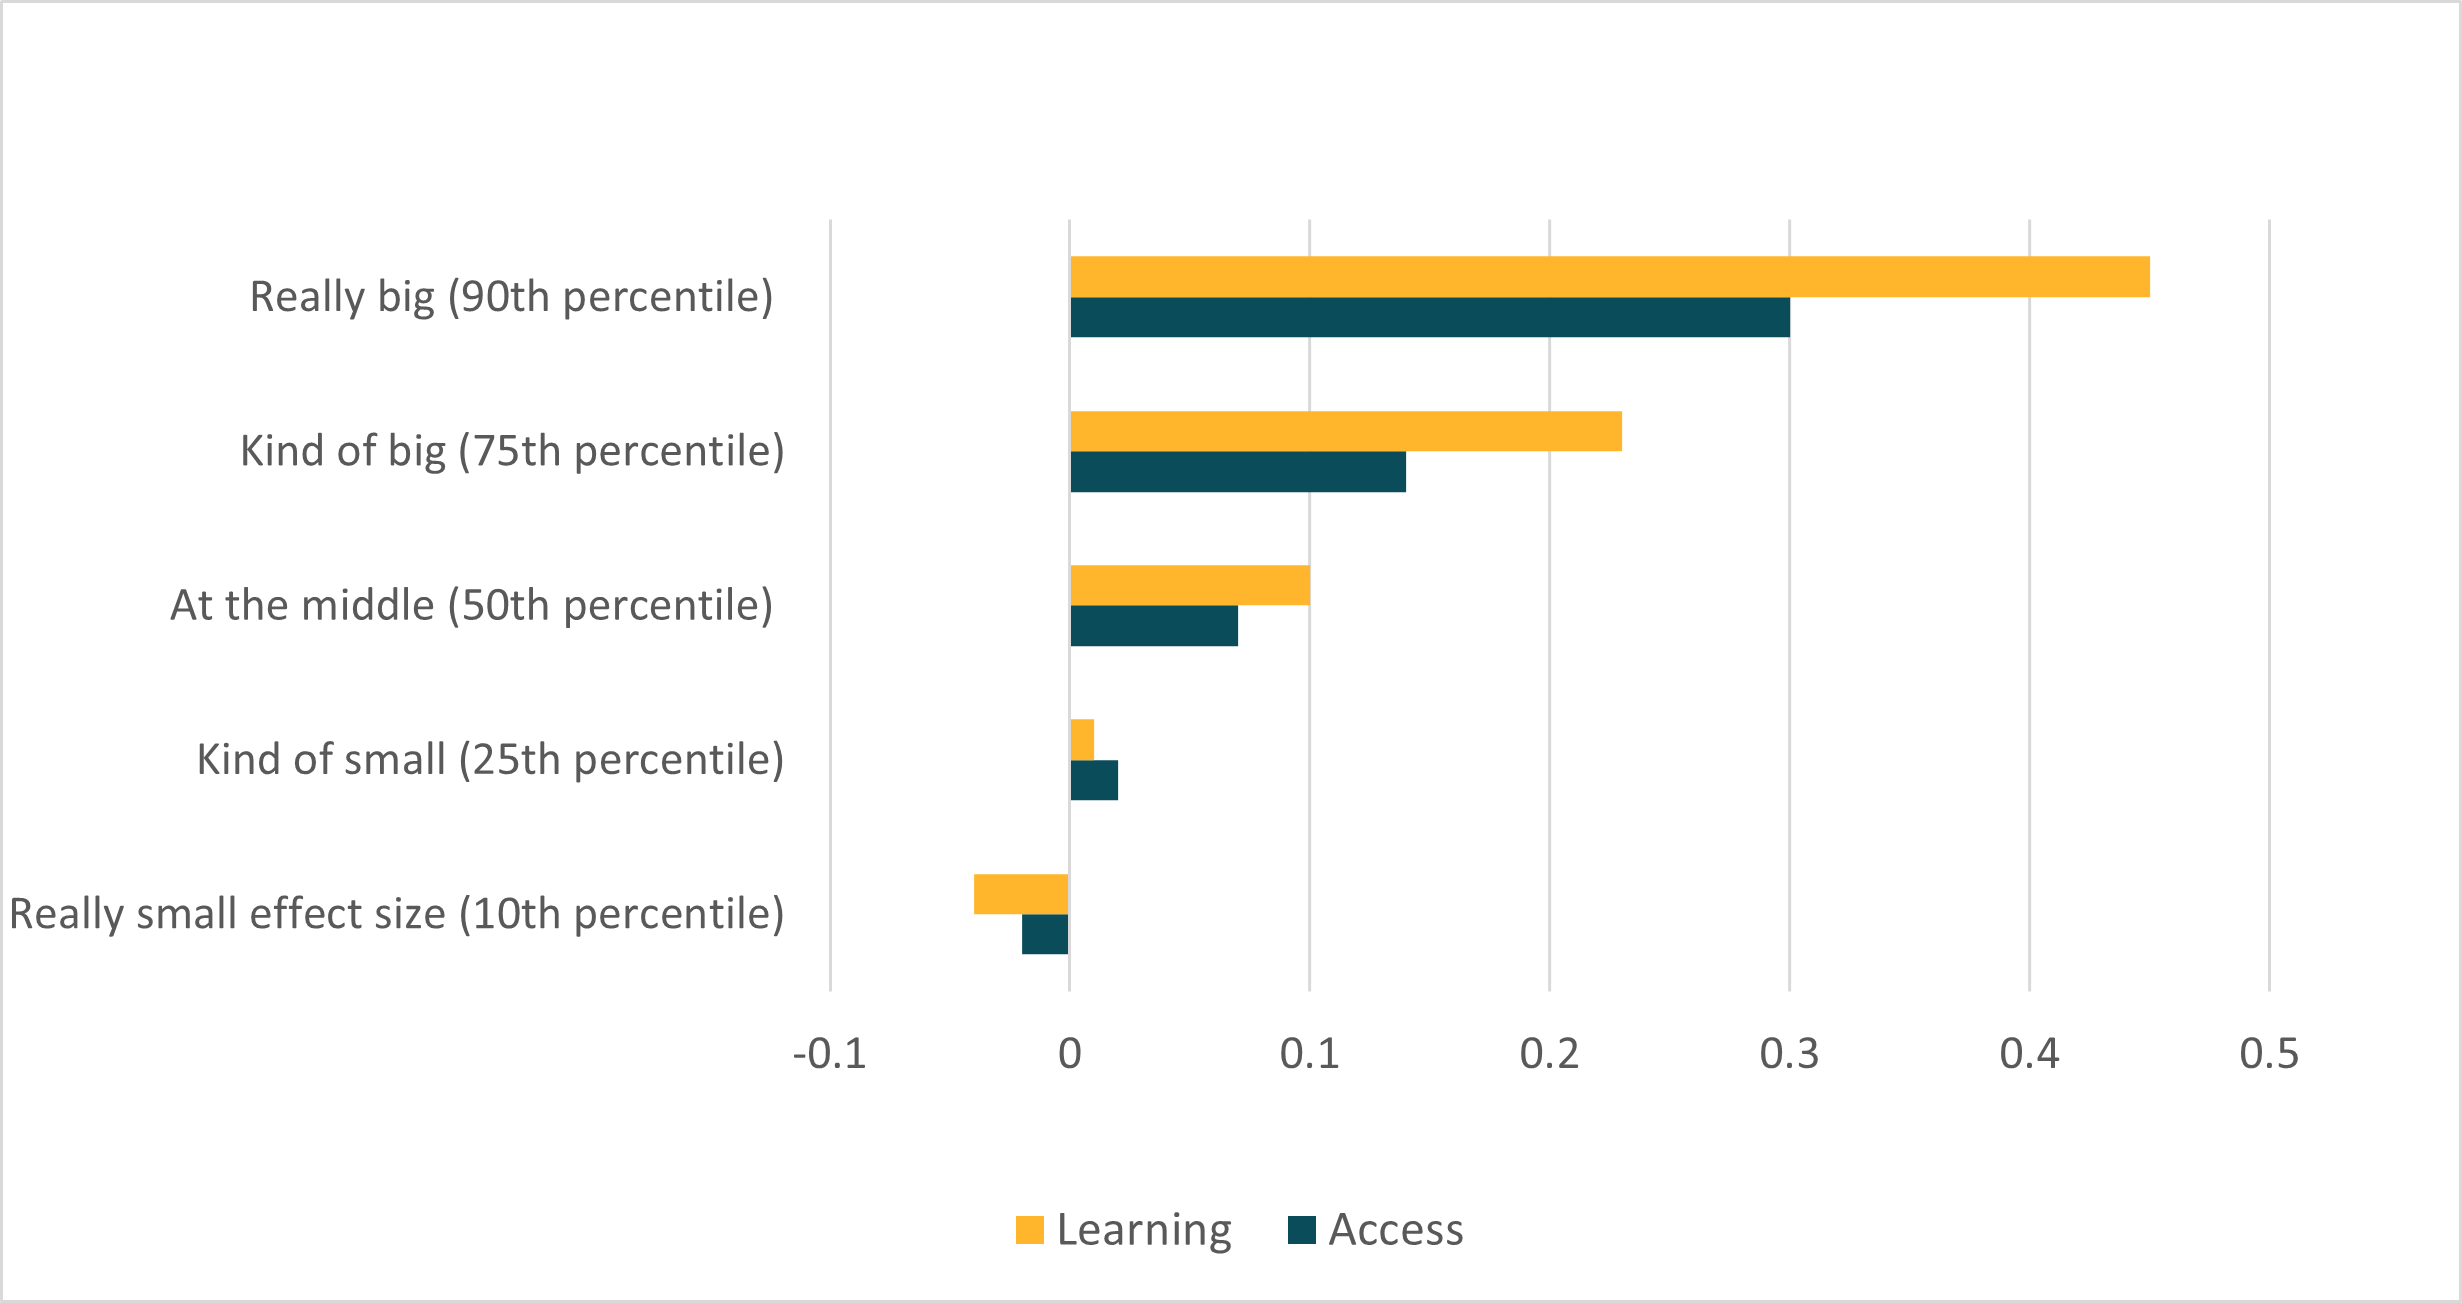
In international education studies with learning outcomes evaluated by RCT, we find a median effect size of 0.10 SDs, just like Kraft did (see the figure below). The 25th percentile of effect sizes is just 0.01 SDs; the 75th percentile is 0.23 SDs. So even studies with effects among the largest 25 percent may be smaller than what many researchers have historically considered to be a “big” effect size. Among quasi-experimental studies, the distribution is similar (with a slightly lower median and a slightly wider spread).
For studies that examine access outcomes, effects are even smaller: the median intervention has an impact of 0.07 SDs, the 25th percentile is 0.02 SDs, and the 75th percentile is 0.14 SDs. (The median is—again—slightly lower for quasi-experimental studies, with a wider spread.)
For studies that examine access outcomes, effects are even smaller: the median intervention has an impact of 0.07 SDs, the 30th percentile is 0.03 SDs, and the 70th percentile is 0.12 SDs. (The median is—again—slightly lower for quasi-experimental studies, with a wider spread.)
How big of an impact do most international education interventions have?
In our sample, we have big interventions that reach many thousands of students, and small pilots that just reach a few hundred. We find much bigger effect sizes for small studies than for large ones: The median impact is almost three times for studies with a sample size in the bottom quartile as it is for studies with a sample size in the top quartile. For access outcomes, small studies find impacts two and a half times as large as large studies. Of course, these aren’t causal comparisons: no one randomized which interventions to implement at small scale and which to implement at large scale. But they do suggest that we shouldn’t be surprised by modest effect sizes from large-scale programs.
The problem with standard deviations
Standard deviations, of course, are not necessarily comparable across studies (despite the name). They vary across populations. They vary across types of tests. That’s why we don’t propose a specific cut-off for a “big” effect size: a big effect size will depend. We encourage researchers to link their standard deviation estimates to real-world equivalents. For example, an intervention in Liberia increased reading scores by 0.16 SDs, which Romero and Sandefur explain is “equivalent to 4 words per minute additional reading fluency.” A study in Kenya identified a 0.10 SD boost in children’s motor and language development, which Jakiela and others show is the same as the difference in development between “children of primary-educated and secondary-educated mothers.” Until we overcome the challenges in comparing standard deviations, linking effect sizes to concrete, intuitive differences can help readers to understand whether an effect is “big” or not. (Eventually, maybe different papers can start using the same concrete, intuitive differences to provide intuition.)
Takeaways
Understanding the distribution of standardized effect sizes helps researchers and research consumers to contextualize the impacts reported in new studies within the broader literature. Old benchmarks (like 0.80 for a “big” effect size) may be unrealistic when 90 percent of studies report effects smaller than 0.45 standard deviations—as we find in our sample of learning impacts—or, as in the Kenya example above, 0.10 standard deviations represent a substantive difference. A sizeable impact may just come with a smaller number than you expected.
Disclaimer
CGD blog posts reflect the views of the authors, drawing on prior research and experience in their areas of expertise. CGD is a nonpartisan, independent organization and does not take institutional positions.