Recommended
BRIEFS
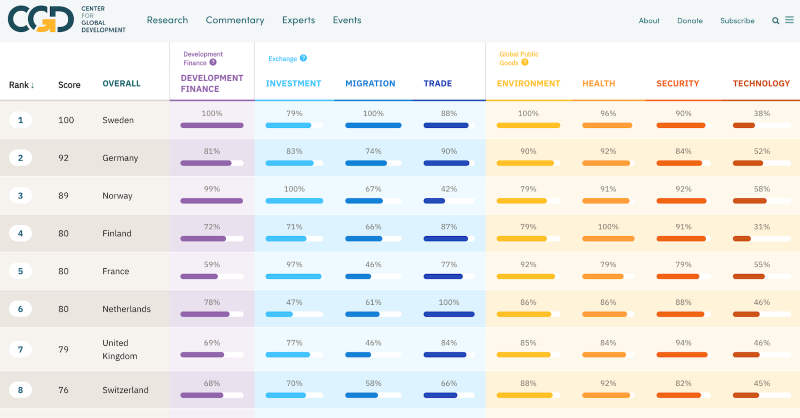
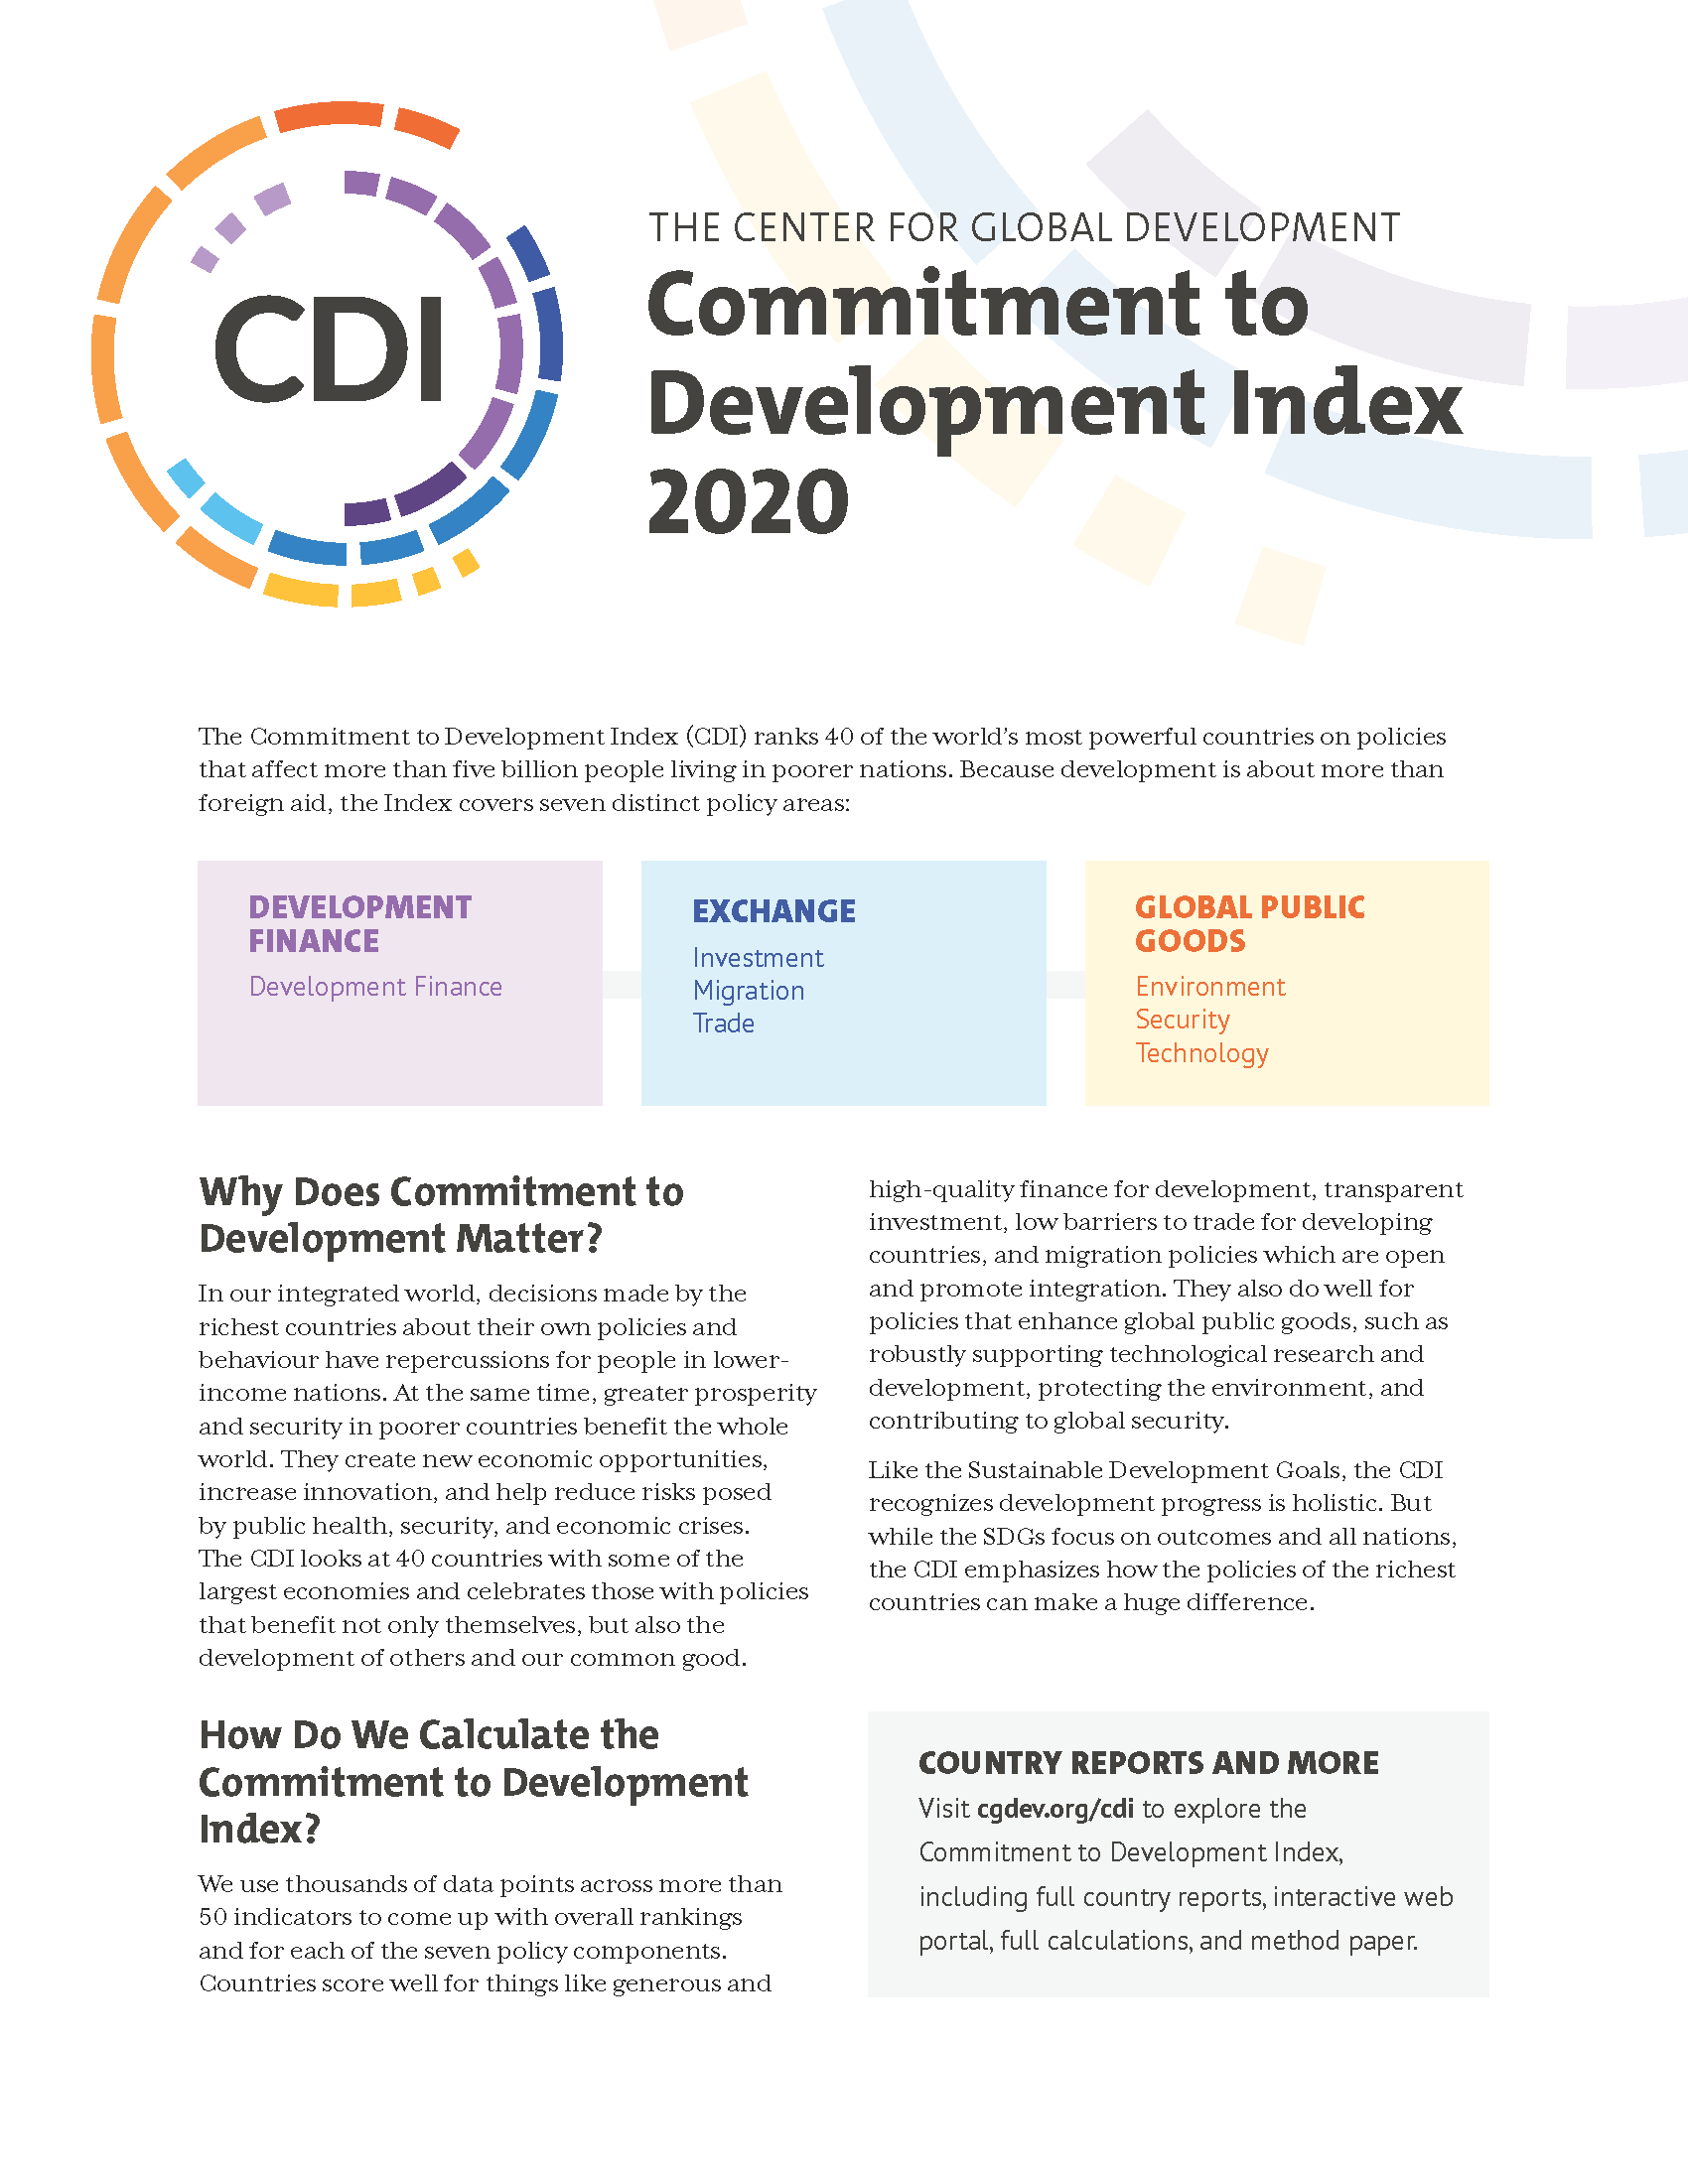
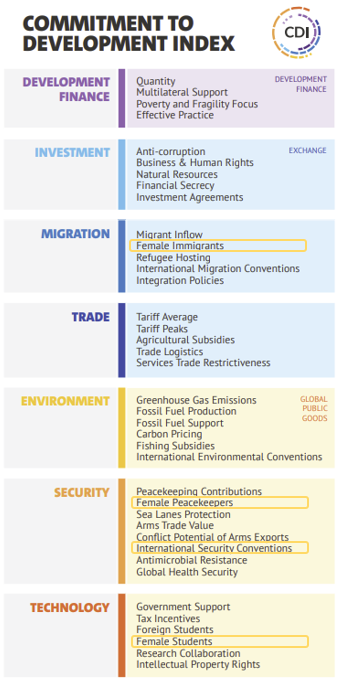
Earlier this year, we launched the Commitment to Development Index (CDI), after commissioning a holistic two-year review to reassess which policies from the world’s major economies matter most for global development.
One major area of feedback in the review discussions was that we should assess policies that support gender equality in development. As the CDI approach is to look mainly beyond aid, we did not focus on how much ODA is allocated to gender-related projects, but instead on other policy areas. Our colleagues, Charles Kenny and Megan O’Donnell, have previously looked at how migration channels, trade policies, and defence efforts can more effectively promote gender equality, not just at home but also abroad.
Guided by this evidence and the available data, we focused on four gender-disaggregated indicators, which fit within the Security, Migration, and Technology components of the CDI (described in more detail below).
In this this blog we refer to women (gender, the social construct) rather than females (sex, which is biological), though for the indicators we refer to the data as described by the source. Even so, in both the OECD and UN data we draw on, gender and sex are used interchangeably.
An overview of results
Overall, we find that Australia and Norway rank highest on the gender indicators we assess, while Turkey and India lag furthest behind—a result generally consistent with their ranks in the overall CDI. However, if we zoom in, we can see that there are some large variations between a country’s overall commitment to development, and its performance against these gender indicators.
Notably, Germany, which comes in the top five countries on the overall CDI for its strong commitment to trade, investment, and migration, also comes in the bottom 10 countries when we assess performance only based on gender indicators. Meanwhile, Argentina, which comes 33rd out of the 40 CDI countries outperforms on gender indicators thanks in part to the large proportion of foreign women students it accepts.
Fig.1. Top 5 Countries’ Performance on Gender Indicators in the CDI
| Country | Rank* on Gender | Women and Girl Migrants (%) | Women Students (%) | Female peace-keepers (%) | Resolution 1325 (%) | Rank on CDI (of 40) (%) |
|---|---|---|---|---|---|---|
| Australia | 1 | 53 | 48 | 18% | Ratified | 8 |
|
Norway |
2 | 49 | 54 | 17 | Ratified | 3 |
| Argentina | 3 | 47 | 60 | 10 | Ratified | 33 |
| Belgium | 4 | 48 | 58 | 9 | Ratified | 11 |
| United States | 5 | 54 | 44 | 13 | Ratified | 18 |
Note: *The ranking is based on the mean of the four indicators after their values are standardised. This differs from the average of the percentages - the effect is that countries receive more credit where an indicator value is further above the mean
Gender indicators: What they are and why they matter
Based on the advice from our CDI review, including discussions with policy-makers and specific input from a London School for Economics and Political Science consultancy team, we included four indicators on gender in the CDI: These are:
- the share of women in overall migrant inflows;
- the share of women in foreign students;
- the share of peacekeepers sent to UN peacekeeping missions that are female;
- whether or not a country has signed UN Resolution 1325 on Women, Peace and Security.
Migration
As the International Organisation for Migration notes, gender plays a critical part in shaping both the reason why someone may migrate, as well as their experiences of migration. Through migrating, women widen their access to gain better skills and employment. But migration is not only an economic opportunity — social remittance effects are an important part of the story when talking about migration as a driver of development. These effects have been observed to be stronger when it is women who migrate. In this way, returning women migrants contribute to changing social norms in their origin countries, for example through pushing for better political accountability and transparency or for more gender equality.
While the average share of women migrants in the 40 countries we look at is 46.7 percent, there remains large variation between the CDI countries—and even a gap of 3.3 percent from “equality” at 50 percent is significant, given the absolute volumes of migration flows every year. This means that hundreds of thousands of women every year are not granted the same opportunity as men. While 54 percent of the migrants the United States accepts are women and girls, the figure is under 40 percent of migrants to Germany, Poland, and the Slovak Republic. Of course, this is only one part of the story: it takes no account of the quality of work women migrants are able to access, for example, or their overall integration, safety, and security within host countries.
Foreign students
Likewise, by accepting women foreign students, countries can widen educational opportunities for women in low- and middle-income countries. This fits with the idea of “brain circulation,” whereby skilled professionals generate benefits to their home countries through, for example, establishing transnational knowledge networks. Of the countries we assess, women students can constitute as much as 60 percent of the foreign student body in Argentina, or as little as 34 percent in Turkey and India.
Women as peacekeepers
When it comes to security, having more women as peacekeepers is linked with reductions in sexual misconduct by peacekeepers and more sustainable peace. Recognising this, the UN Security Council has set targets to achieve at least 20 percent female police deployments by 2020—but progress has been so slow that these unchanged targets have now been pushed back to 2028. On average, across the 40 countries we measure, only 7.7 percent of peacekeeping troops sent on UN peacekeeping and humanitarian missions are female. Australia and New Zealand, which come out on top of this indicator, send the highest share of women peacekeepers at still just 18 percent.
Support of international commitments
Finally, the landmark UN Resolution 1325 signals countries’ commitment to strengthening women’s roles in humanitarian response and in post-conflict reconstruction—and we reward countries who have signed on. Twelve of the 40 countries we assess have not signed the resolution, including China, India, Russia, Greece, and Mexico.
These four indicators provide only a partial picture, and we’d welcome further suggestions as data improves—but we feel it gives a robust evidence-based starting point to reflect countries’ prioritization of gender equality ‘beyond aid.’ But with 52 indicators in the CDI in total, collectively these four matter to a countries’ performance.
Is a “feminist foreign policy” enough?
Although countries’ development-related policies may appear “gender neutral” on the surface, they may nonetheless present barriers for women’s participation. In fact, when the effects of policies are not disaggregated based on gender, a resulting “gender data gap” can undermine efforts: what does not get measured does not get managed.
Where the data does exist, and we are able to include in the CDI, the variation we see in outcomes on women students, migrants, or peacekeepers across countries suggests that their policies play a clear role in either driving inequalities or widening opportunities for women.
It highlights how even countries that have announced “feminist foreign policies”—like Sweden, Canada, Luxembourg, France and most recently, Mexico —still have a long way to go. These commitments are admirable, but our results suggest other areas of domestic policy can still accelerate progress.
As with any assessment in the CDI, the goal is to inform debates on what constitutes good development policy and to encourage improvements. We welcome suggestions for how to better measure countries’ commitment to gender in development policy beyond aid in future editions of the CDI.
See full gender rankings here
Country performance on CDI 2020 and gender indicators
| Country | Rank* on Gender | Women and Girl Migrants (%) | Women Students (%) | Female Peace-Keepers (%) | Resolution 1325 | Rank on CDI |
|---|---|---|---|---|---|---|
| Australia | 1 | 53 | 48 | 18 | Ratified | 8 |
| Norway | 2 | 49 | 54 | 17 | Ratified | 3 |
| Argentina | 3 | 47 | 60 | 10 | Ratified | 33 |
| Belgium | 4 | 48 | 58 | 9 | Ratified | 11 |
| United States | 5 | 54 | 44 | 13 | Ratified | 18 |
| Canada | 6 | 51 | 46 | 15 | Ratified | 14 |
| New Zealand | 7 | 48 | 47 | 18 | Ratified | 15 |
| Spain | 8 | 52 | 52 | 6 | Ratified | 20 |
| Netherlands | 9 | 50 | 54 | 6 | Ratified | 20 |
| Ireland | 10 | 50 | 54 | 6 | Ratified | 19 |
| France | 11 | 49 | 52 | 7 | Ratified | 2 |
| Sweden | 12 | 46 | 48 | 14 | Ratified | 1 |
| Czechia | 13 | 41 | 54 | 7 | Ratified | 10 |
| Denmark | 14 | 48 | 51 | 7 | Ratified | 10 |
| South Korea | 15 | 47 | 57 | 4 | Ratified | 26 |
| Portugal | 16 | 48 | 51 | 6 | Ratified | 16 |
| United Kingdom | 17 | 46 | 54 | 7 | Ratified | 4 |
| Austria | 18 | 46 | 53 | 4 | Ratified | 9 |
| Chile | 19 | 45 | 54 | 5 | Ratified | 23 |
| Switzerland | 20 | 47 | 50 | 4 | Ratified | 13 |
| Mexico | 21 | 48 | 50 | 15 | Not Ratified | 32 |
| Italy | 22 | 42 | 57 | 4 | Ratified | 17 |
| Israel | 23 | 52 | 56 | 0 | Not Ratified | 38 |
| Greece | 24 | 47 | 52 | 11 | Not Ratified | 28 |
| Luxembourg | 25 | 46 | 50 | 0 | Ratified | 6 |
| Russia | 26 | 47 | 50 | 11 | Not Ratified | 36 |
| South Africa | 27 | 47 | 44 | 17 | Not Ratified | 25 |
| Indonesia | 28 | 47 | 44 | 3 | Ratified | 34 |
| Finland | 29 | 44 | 45 | 7 | Ratified | 12 |
| Japan | 30 | 47 | 45 | 2 | Ratified | 21 |
| Brazil | 31 | 47 | 44 | 2 | Ratified | 30 |
| Poland | 32 | 38 | 51 | 8 | Ratified | 31 |
| Hungary | 33 | 41 | 50 | 16 | Not Ratified | 24 |
| Slovak Republic | 34 | 39 | 58 | 8 | Not Ratified | 27 |
| Germany | 35 | 39 | 48 | 4 | Ratified | 5 |
| UAE | 36 | 47 | 50 | 0 | Not Ratified | 40 |
| China | 37 | 47 | 45 | 3 | Not Ratified | 35 |
| Saudi Arabia | 38 | 47 | 45 | 0 | Not Ratified | 39 |
| Turkey | 39 | 48 | 34 | 3 | Not Ratified | 39 |
| India | 40 | 47 | 43 | 1 | Not Ratified | 37 |
* The ranking is calculated by the mean of the four indicators after their values are standardised. This differs from the straight average of the percentages - the effect is that countries receive more credit where an indicator value is further above the mean
Disclaimer
CGD blog posts reflect the views of the authors, drawing on prior research and experience in their areas of expertise. CGD is a nonpartisan, independent organization and does not take institutional positions.
Image credit for social media/web: UN Women/Catianne Tijerina