The United Nations Conference on Trade and Development (UNCTAD) has recently reissued a new version of the report on commodity trade misinvoicing which caused such controversy last summer.
Misinvoicing is a form of trade-based money laundering involving exporters and importers conspiring to deliberately misreport the value of commercial transactions to customs. The report by Professor Léonce Ndikumana analysed mismatches in international trade data in the UN COMTRADE database for seven country-commodity pairs: gold, silver/platinum and iron ore from South Africa, copper from Chile and Zambia, cocoa from Cote D’Ivoire, and oil from Nigeria. In all seven cases it came to a single conclusion: there were substantial levels of misinvoicing.
But discrepancies in trade statistics are simply not the same thing as customs fraud, and what the report actually revealed is how ordinary trade patterns can be systematically converted into massive misinvoicing estimates. This is not just a minor measurement issue, but is fundamental to global understanding of illicit financial flows.
The great gold heist that never was
Last July UNCTAD published the original report which calculated that “virtually all gold exported by South Africa leaves the country unreported,” accusing mining companies of smuggling billions of dollars’ worth of gold (and implicitly suggesting that the South African authorities had turned a blind-eye).
This was promptly disputed by the South African Chamber of Mines and the South African Revenue Authority. The Chamber of Mines commissioned an independent report from economics consultancy Eunomix which found that (as you might expect) the mining companies and public agencies do report gold exports, just not in the right format for COMTRADE. They found that three quarters of the observed discrepancy could be explained just by looking up the official statistics.
The review concluded that:
In addition to justifying questions on the scientific validity of the UNCTAD study, the lack of effort to find alternative data sources and the lack of alternative hypotheses render acceptable questions about the motives of the report. Indeed, the conclusion that the report sought to prove a tenuous hypothesis by excluding alternative perspectives and approaches, and focusing on a monodimensional empirical analysis without alternative hypotheses and data sources is not unreasonable.
Ouch.
UNCTAD revises report
On December 23, UNCTAD published an updated version of the report.
The new report and accompanying note do acknowledge that there are alternative explanations for the discrepancies (such as higher than expected transport costs), but it quickly dismisses them as being implausible. While the language of some of the claims is moderated and a couple of the calculations adjusted, the main conclusions remain unchanged.
|
|
|
|
|
|
|
|
|
|
|
|
|
|
|
|
|
|
|
|
|
|
|
|
|
|
|
|
|
|
|
|
|
|
|
|
|
|
|
|
[in relation to ‘world’, various periods]
Getting a feel for scale
Why does UNCTAD remain so convinced? Ndikumana says “the sheer magnitude of the estimates suggests that the problem is real and it must be tackled with all the attention it deserves.” Janvier Nkurunziza, chief of UNCTAD's Commodity Research and Analysis Section says that the discrepancies are “simply too large to be caused by simple human error or methodological differences.”
That sounds like circular reasoning to me, particularly as the South Africa case has already demonstrated that very large estimates can derive from inconsistencies in the way that different countries report commodities.
Reading through the report (and its charts), it is hard to judge the relative scale of each case, because they are presented using a bewildering array of secondary axes for overall export volumes (including in some cases, exponential scales). Below is my attempt at setting out the net misinvoicing estimated in each case, relative to overall exports.
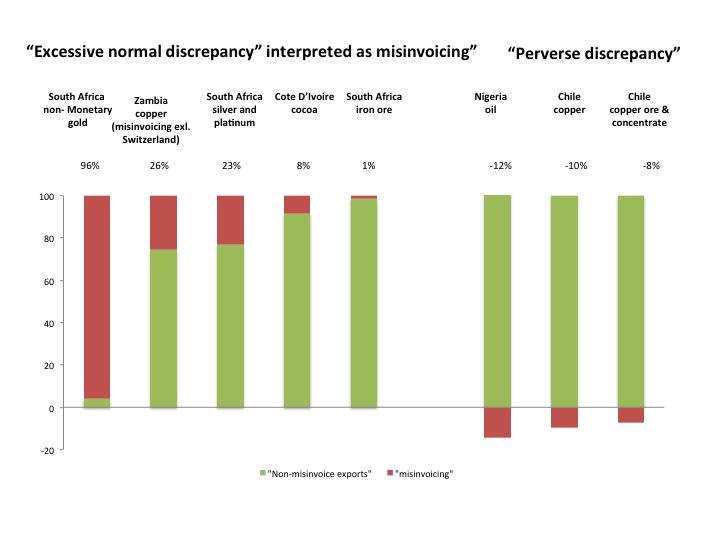
Too large not to be real?
Three findings seem to fall into the “sheer magnitude” category: South African gold, South African platinum/silver, and Zambian copper. Yet in each of these cases there is a much simpler explanation.
Gold export from South Africa: massive smuggling or a classification issue?
The report continues to interpret the almost complete mismatch of South Africa’s reported gold exports in COMTRADE as misinvoicing.
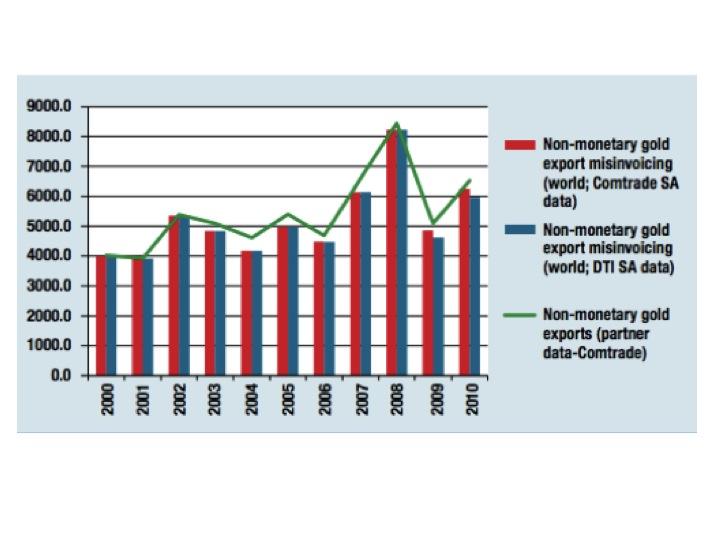
The South African Revenue Service and the Eunomix report have already pointed out that the cause for this. Most gold exports from South Africa were, until 2011, classified as “monetary” gold, but partners counted these imports as “non-monetary” gold. However Ndkikumana insists that these gold exports remain unaccounted for. He rejects the approach of reconciling the puzzling data by combining monetary and non-monetary gold records, saying that this would be comparing ‘apples and oranges.’
But apples and oranges are quite different physical commodities. Bars of gold bullion are not—they are considered monetary or non-monetary by virtue of whether they are being held as assets by monetary authorities, and can be classified differently by different countries, and over time. The UK for example reclassified ‘monetary gold’ trade to ‘non-monetary gold’ in 2011, increasing reported imports from non-EU countries by 10 percent at the stroke of a pen.
Silver and platinum exports from South Africa: gaps in the data
The analysis of silver and platinum misinvoicing is unchanged in the revised report. It notes that the overall estimate of misinvoicing is made up of a combination of years when the discrepancy in the trade data is relatively small, and a few years when there are substantial discrepancies.
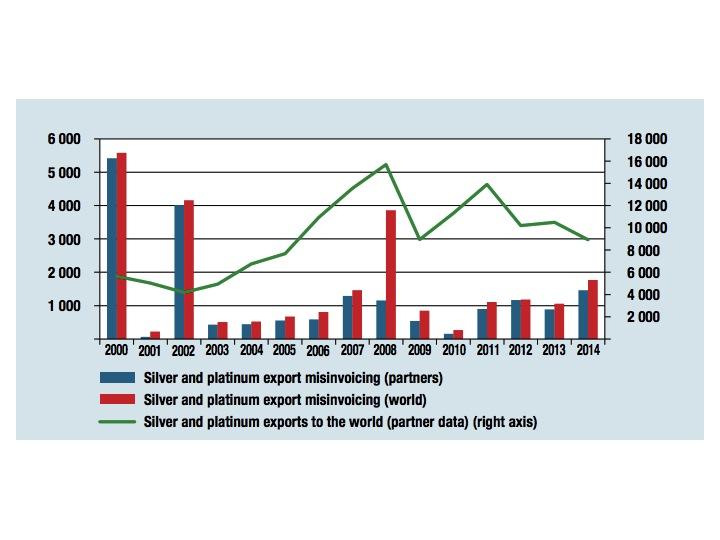
In other words, it describes a scenario where the industry swung from legal compliance, to massive undetected smuggling, and then back again on an annual basis (and that one noticed). This seems unlikely. In particular this story ignores the observation by Dewald van Remsburg at City Press—that the COMTRADE database contains no record of South Africa’s platinum exports in 2000 and 2002, but SARS statistics show normal levels of platinum exports . The UNCTAD study attributes several billions of dollars worth of underinvoicing by exporters to the gap in the COMTRADE data for these two years.
Zambian copper exports to Switzerland: now you see it, now you don’t
The original report estimated that there was systematic overinvoicing of Zambian exports of copper to Switzerland and the UK and systematic underinvoicing to everywhere else, generating a net result of $17 billion of overinvoicing versus the world. It suggested something peculiar and mysterious was going on since on paper the main customer for Zambian copper is Switzerland, but in practice barely any of the metal arrives there.
The revised report recognizes that the exports to Switzerland reflect the role of Swiss commodity trading. The solution it adopts is simply to remove the misinvoicing estimates involving Switzerland from the charts and tables on Zambia copper. Thus the finding is now flipped from net overinvoicing to $14.5 billion of underinvoicing.
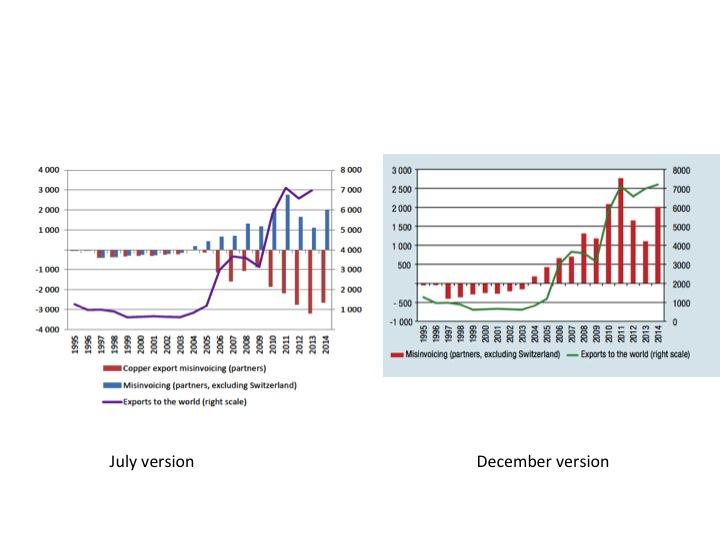
This ad-hoc approach of simply ignoring 50 percent of reported exports makes no sense, and is inconsistent with the rest of the report. As Ndikumana argues elsewhere; inconsistencies in recording the destination and origin of products can generate spurious misinvoicing estimates for individual country pairs—which are netted out in the ‘world’ calculation. For example if copper is reported as an export from Zambia to Switzerland, but in practice sits in a bonded warehouse before being delivered to Germany, this would show up as ‘overinvoiced exports’ to Switzerland and ‘underinvoiced exports’ to Germany. Netting the two is the right thing to do, as it reflects that there was in fact no misinvoicing, no illicit financial flow. Ignoring the reported exports from Zambia to Switzerland, as the revised report does, while counting the corresponding import by Germany turns ordinary merchanting trade dollar-for-dollar into “evidence of underinvoicing.”
Too small to tell
The calculations assume transport and insurance costs are 10 percent of product value, and that any deviation from this is over- or under-invoicing. However we know this is not always true: for example last year iron ore exported to China from Latin America or West Africa would get a sales price of approximately 60 $/ton at the Chinese port, and a freight rate of about 9 $/ton. But pricing at $51/ton at point of export this ordinary, legally compliant trade would generate an underinvoicing estimate of 8 percent.[1]
In cases where the overall margin of apparent misinvoicing is slim, there is no basis for confidence that the discrepancies can be distinguished from ordinary transport and warehousing costs. In almost every case in the UNCTAD study the pattern of apparent misinvoicing can be explained with a simpler story:
- Cote D’Ivoire cocoa – Cocoa beans are graded, sorted, cleaned, blended, fumigated, and stored in bonded warehouses in Amsterdam before being delivered to European chocolate manufacturers. Is the 8% difference in value a reflection of this, or customs fraud?
- South Africa Iron Ore –Iron ore prices were rising till 2009 iron then fell gradually, while shipping costs fell precipitously. Does the observed ‘drastic’ shift from apparent underinvoicing to overinvoicing reflect changing relative transport costs, or were hundreds of alleged secret side deals inexplicably renegotiated?
- Copper overinvoicing –Copper Cathode sells at about $5,000 / tonne, while freight shipping rates are measured in tens of dollars. Does the trade data reflect the fact that copper is a relatively valuable good compared to transport costs, or does it reveal general unexplained overinvoicing by copper exporters?
The problems are not just in the UNCTAD report
The report lays out more clearly than any previous study the nature of the data and assumptions used to generate massive misinvoicing estimates. It is clear that simpler explanations are available, involving basic measurement problems and methodological choices. This can’t be ignored any more.
The lessons from this go beyond the UNCTAD study. The UNECA High Level Panel report on Illicit Financial Flows (‘Africa is losing $50 billion to misinvoicing’) uses a similar methodology, and the same country-commodity pairs are strong contributors. In fact, gold, silver, and platinum are the second largest source of alleged misinvoicing in the UNECA study, and almost all of this relates to Southern Africa, where it is now clear that the explanation is much more pedestrian.
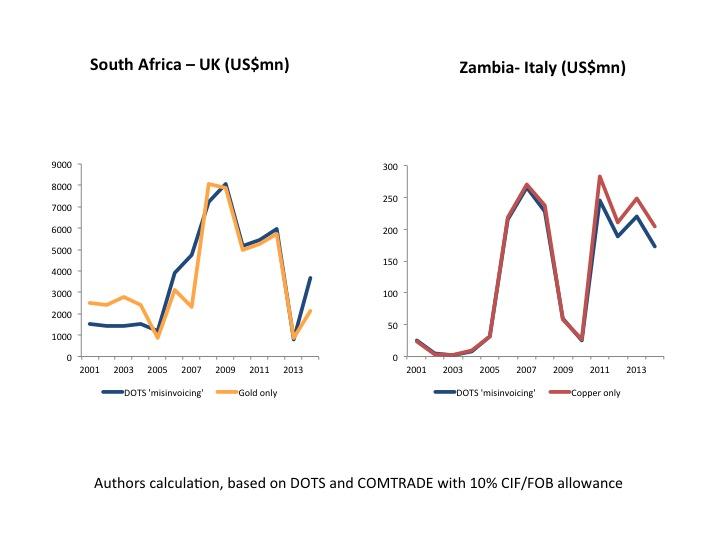
Global Financial Integrity (GFI)’s main methodology for estimating trade misinvoicing uses IMF direction of trade statistics (DOTS) representing the aggregate value of all products and commodities. It is likely that it picks up the same issues. This can be seen for example by looking at South Africa-UK and Zambia-Italy exports. In the first case almost all of the discrepancy in DOTS seems to be related to gold, while in the second it is almost all copper.
Importantly, the UNCTAD report highlights how transit and merchanting trade, and the use of bonded warehouses, can result in large trade data discrepancies arising at a national level (this is a variation of the well-known ‘Rotterdam effect’). Ordinary, legitimate trade can generate a pair of discrepancies involving three countries (for example a single shipment could lead to apparent underinvoicing from Zambia-Switzerland and equal apparent overinvoicing from Zambia-Germany). Ndikumana’s ad-hoc step of excluding Switzerland from the Zambia copper analysis leads to meaningless results. However Global Financial Integrity’s ‘Gross Excluding Reversals’ method is based on the same general principle. GFI argue that perverse discrepancies are evidence of overinvoicing, indicating tax evasion or capital going into the underground economy. Netting it off they say would be “is akin to the concept of net crime”, therefore they set them to zero. It is ignoring these observed discrepancies in one direction that generates the large misinvoicing estimates.
Methodologies and magnitudes—why they matter
Cross border-criminals, money launderers, bribe payers, bribe takers, and tax evaders do hide transactions amongst legitimate trade flows. The problem is real.
However it turns out that the idea that such illicit financial flows can be reliably identified through simple calculations using publicly available data was overoptimistic. The UNCTAD study reveals clearly how these calculations systematically transform records of ordinary trade flows into large misinvoicing estimates.
The revised report was a missed opportunity to check the misinvoicing interpretation against the real-world knowledge of commodity traders and trade analysts, and those who work to investigate and prosecute smuggling, tax evasion, and customs fraud. Instead it trod carefully so as not to disturb the assumptions which hold up the precarious edifice of large misinvoicing estimates.
These estimates do not help to understand the scale and nature of trade-based money laundering, or the broader problem of corruption and theft of public assets. Furthermore, they create perceptions that companies doing international business in developing countries must be getting away with hiding vast illicit flows, while customs, revenue and statistics agencies in developing countries must all be utterly incompetent or complicit. It is hard to see how continuing to place confidence in these estimates and methodologies contributes to solving real problems.
[1] Thanks to David Mihalyi at the Natural Resource Governance Institute for his help with this calculation.
Disclaimer
CGD blog posts reflect the views of the authors, drawing on prior research and experience in their areas of expertise. CGD is a nonpartisan, independent organization and does not take institutional positions.