On Wednesday, Angus Deaton published an op-ed in the New York Times that paints a compelling picture of the depth of poverty in America, and the need for more money and more policy attention to fix it. It's a sobering read, and we strongly agree that America’s most destitute deserve far more support.
But in comparing US poverty to poverty in developing countries, we think he’s got his numbers wrong. In short, the Nobel laureate's recent claim that 5.3 million Americans live below the World Bank's absolute poverty line—and thus foreign aid should be redirected back home—compares income data for the US to consumption data from developing countries. Comparing like with like suggests a very different picture.
Deaton's empirical claim
Deaton won the Nobel in large part for his work on the measurement of global poverty. Thus it is with some fear and trepidation that we contest Deaton's empirical claim about the extent of poverty in America compared to the developing world. It's worth quoting at length:
Surely no one in the United States today is as poor as a poor person in Ethiopia or Nepal? As it happens, making such comparisons has recently become much easier. The World Bank decided in October to include high-income countries in its global estimates of people living in poverty. We can now make direct comparisons between the United States and poor countries.
Properly interpreted, the numbers suggest that the United Nations has a point—and the United States has an urgent problem. They also suggest that we might rethink how we assist the poor through our own giving.
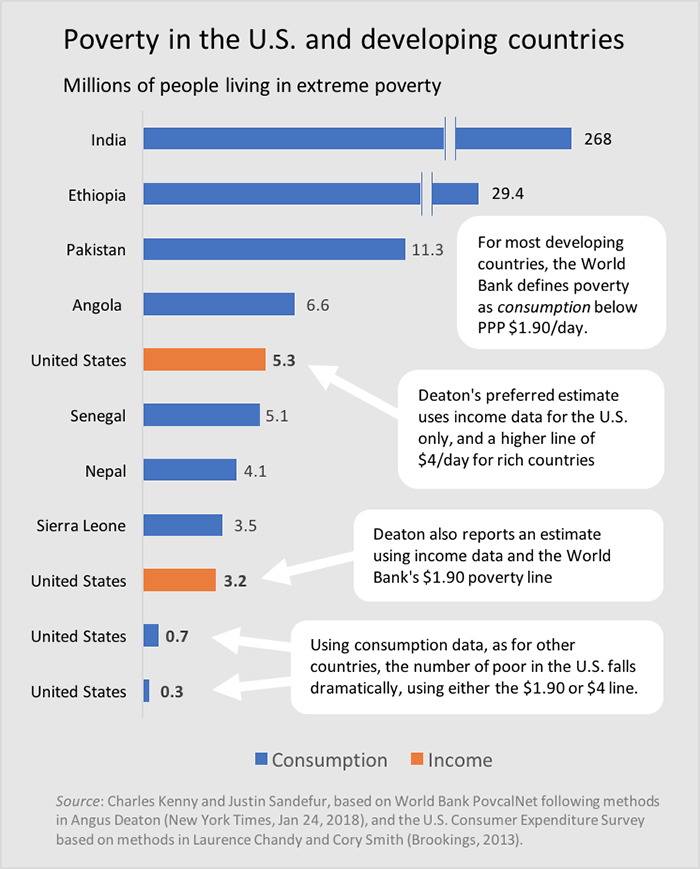
According to the World Bank, 769 million people lived on less than $1.90 a day in 2013; they are the world’s very poorest. Of these, 3.2 million live in the United States, and 3.3 million in other high-income countries (most in Italy, Japan and Spain).
If you visit the World Bank's "PovcalNet" online poverty calculator, you can recreate the numbers Deaton cites here. But the numbers are misleading for this purpose. PovcalNet measures poverty using consumption data for most poor countries, but income data for rich countries. The World Bank’s report Taking on Inequality (p. 24) describes the difference:
The United States is a good example. According to some estimates, 1 percent to 4 percent of the population there (measured by income) is living below a $2.00-a-day poverty line (in 2005 prices). If welfare is measured by consumption, however, high-income countries typically report no poverty at all. This is because the poor in these countries generally have access to free public services and social transfers that are not accounted for in the income aggregate, but that ensure that the population’s consumption levels are above the recognized poverty standards.
We think the income numbers the Bank uses capture the impact of at least some government safety net programs—the documentation isn’t clear—but the income-consumption gap remains. Laurence Chandy and Cory Smith produced an excellent report for Brookings in 2013 looking precisely at this question of how many Americans fall below a $2-a-day poverty line. They stress the difference between income and consumption measures, and the importance of welfare programs in the calculation, noting:
social protection programs play a critical role in the welfare of many of America’s poorest households. According to the [Survey of Income and Program Participation], programs such as food stamps (SNAP) and the Earned Income Tax Credit mean the difference between living above or below the $2 threshold for millions of people.
Using income measures from the most relevant sources (SIPP or SPM), they found the percentage of Americans living on less than $2 is even higher than PovcalNet reports, ranging from 2 percent to 4 percent. (SNAP, housing subsidies, and tax credits reduce the share by about 1 percent.) But using consumption measures from the US Consumption and Expenditure Survey yields a poverty rate of 0.07 percent. (The number is unchanged if we move the line down to $1.90.) That would imply about 229,000 people below the World Bank's poverty line in the United States, rather than the 3.2 million Deaton suggests.
Using a higher poverty threshold in the US
For his main calculations, Deaton uses a higher poverty line for the US than the World Bank does, with reasonable justification:
The Oxford economist Robert Allen recently estimated needs-based absolute poverty lines for rich countries that are designed to match more accurately the $1.90 line for poor countries, and $4 a day is around the middle of his estimates. When we compare absolute poverty in the United States with absolute poverty in India, or other poor countries, we should be using $4 in the United States and $1.90 in India.
Once we do this [i.e., switch to a $4 poverty line for the US], there are 5.3 million Americans who are absolutely poor by global standards. This is a small number compared with the one for India, for example, but it is more than in Sierra Leone (3.2 million) or Nepal (2.5 million), about the same as in Senegal (5.3 million) and only one-third less than in Angola (7.4 million). Pakistan (12.7 million) has twice as many poor people as the United States, and Ethiopia about four times as many.
Allen suggests a line of $2.03 for India and $3.72 for the United States. Some people, including Martin Ravallion (one of the original creators of the World Bank poverty line), raise important concerns about Allen's method, but we are happy to go along with it. Thanks to rapid and generous sharing of data and code by Chandy and Smith, we’re able to use their analysis to see how many Americans are consumption poor at Deaton’s preferred $4 cutoff. The estimate is 0.22 percent compared to Deaton’s income-based estimate of 1.7 percent.
The number living in $4 poverty in the United States measured on the same (consumption) basis as poverty rates in the developing world is less than 700,000, or less than a quarter of the number of poor people in Sierra Leone. At the same time, it is worth noting that the US government should and does use a far higher income poverty line than $4: the official weighted average income poverty threshold for a family of four in 2016 was $24,563, which works out to about $17 a day. More than 8 million families live below that line.
Helping the Most Destitute at Home or Abroad
Deaton uses his calculation to underpin an argument about where we should direct resources to fight poverty:
I believe, as do most people, that we have an obligation to assist the truly destitute. For those who believe that aid is effective, this is reflected in their own giving, or by supporting national and international organizations like the United States Agency for International Development, the World Bank or Oxfam. For years, in determining this spending, the needs of poor Americans (or poor Europeans) have received little priority relative to the needs of Africans or Asians. . . . Recently, and especially with these insightful new data, I have come to doubt both the reasoning and the empirical support
But the gap between Deaton’s income poverty numbers and the comparable consumption numbers is driven in some part by government assistance programs, which are already many orders of magnitude more generous to poor people in the US than US aid is when it comes to poor people living in other countries. A 2015 GAO report listed more than 80 federal programs targeted to people with low incomes, including Medicaid, the Supplemental Nutrition Assistance Program, Supplemental Security Income, and the Earned Income Tax Credit. In 2013 these programs spent $742 billion. The cash, food and housing programs accounted for $296 billion of that. There were also private charitable donations to similar causes: Giving USA reports $47 billion in donations to human services charities (compared to $22 billion to international affairs charities).
It is a tragedy and indictment that anyone in the United States remains living on less than $4 income a day. But the problem certainly isn’t that we’re favoring the international poor over the domestic poor: domestic cash, food, and housing poverty programs alone are worth nine times net ODA. Sierra Leone received $126 million in bilateral ODA from the United States in 2016, for example—that’s about 11 cents per poor person per day. Overall, US net ODA was $34 billion in 2016. That’s equal to about 12 cents per poor person worldwide (about 800 million of them) per day.
Better targeting using existing funding could easily ensure no one was living on below $4 a day in the US. But that’s not good enough. We should be aiming to end poverty at the official line of around $17 a day. There are more resources to put to the cause: the cash, food, and housing poverty programs listed equal 8 percent of federal spending—that’s less than half the amount we spend on defense, for example. They could be expanded by 50 percent for the same cost as the recent tax cuts passed by Congress. And the US should be more generous when it comes to ending $2 poverty in the developing world, too: net US ODA is equal to about 0.8 percent of federal spending.
For all we argue with Deaton’s numbers, we agree too many Americans are poor. But America is rich—it can afford to better assist both the poor at home and the even poorer abroad.
Thanks to Divyanshi Wadhwa for research assistance, and to Laurence Chandy and Cory Smith for guidance on the use of the Consumer Expenditure Survey data, as well as sharing data and code to reproduce their work.
Disclaimer
CGD blog posts reflect the views of the authors, drawing on prior research and experience in their areas of expertise. CGD is a nonpartisan, independent organization and does not take institutional positions.