The World Inequality Report updates and extends the famous elephant curve, showing slower gains for much of the globe, and even more concentration of economic growth in the top 1 percent.
The "elephant graph" created by Christoph Lakner and Branko Milanovic in a 2013 World Bank paper has become perhaps the most talked-about chart in international economics over the past few years. The simple graph shows income gains at each point of the global income distribution for the 20 years spanning the fall of the Berlin wall to the 2008 financial crisis. China and India's rapid growth constitute the bulk of the elephant, driving down global inequality, while the global 1 percent lift the elephant's trunk, and in between the losers from globalization saw zero income growth—a feature frequently cited by pundits to explain the advent of Trump and Brexit.
The elephant graph is almost five years old now, so it's time for a refresh. Brace yourself. It's not good news.
In December, the team of economists from Berkeley and the Paris School of Economics who have pioneered the study of top incomes—including Facundo Alvaredo, Lucas Chancel, Thomas Piketty, Emmanuel Saez, and Gabriel Zucman—launched the first World Inequality Report (WIR). Compiling all existing household survey sources with their own research on top incomes, they were able to extend the time period covered, and found a somewhat different picture:
Figure 1. The elephant curve of global inequality and growth, 1980-2016
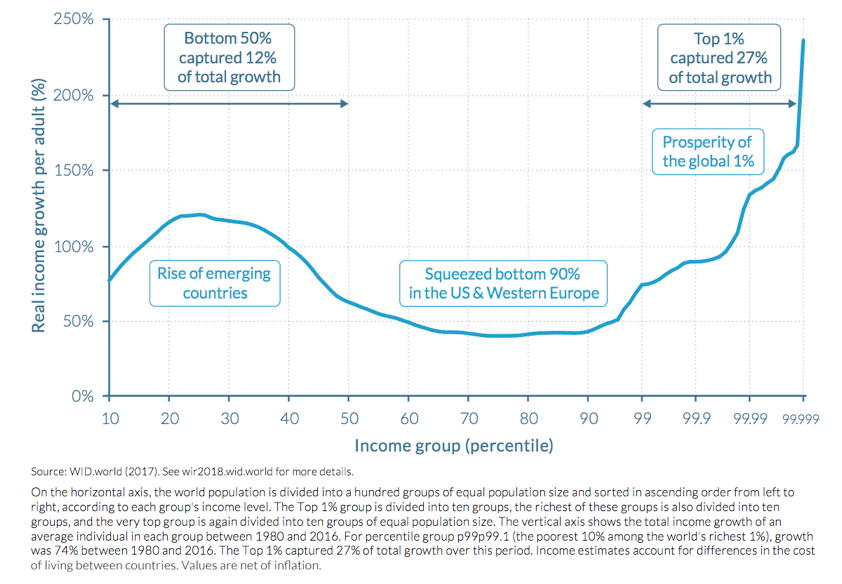
Source: Alvaredo et al. World Inequality Report 2018, licensed under CC BY-NC-SA 4.0
A few things stand out from this new graph:
- The elephant's trunk is getting really, really long. As the caption notes, the top 1 percent captured 27 percent of total income growth from 1980 to 2016. The longer neck reflects the use of more and newer data on top incomes from tax records, which is the specialty of the World Inequality Report team. In contrast, the original Lakner and Milanovic graph was based on household survey data compiled by the World Bank, which the authors readily acknowledged are a poor measure of high incomes—simply because sample surveys are unlikely to randomly capture the (very few) super rich.
The explosion of top incomes at the far right of the graph now dwarfs the whole picture—leading my colleague Charles Kenny to helpfully suggest this looks more like a brontosaurus, or alternatively "Nessie," Disney's version of the Loch Ness monster, than an elephant.
- Maybe it's a Trumpist elephant after all. The WIR authors explicitly label the trough of low growth with the bottom 90 percent in the United States and Western Europe—a claim that has previously been challenged. Adam Corlett of The Resolution Foundation (ht Caroline Freund's blog post here) argued the trough in the Lakner-Milanovic graph was driven more by Japan and Eastern Europe than Trump or Brexit voters. In reply, Lakner and Milanovic noted that the basic ranking of higher growth for the Asian middle class and the global elite, and lower growth for the middle class in the rich world is robust to any version of the calculation—and that seems to remain true in the new WIR version.
- The whole elephant is sinking. In the original graph, the body of the elephant peaked at about the global median income, which saw roughly 75 percent cumulative income growth over 20 years, equivalent to an annual rate of just under 3 percent per annum. In the new Alvaredo et al version, the highest growth rate apart from the super rich comes for people at about the 20th percentile, who saw a 120 percent cumulative increase over 36 years—which is about half a percentage point slower per year.
Is that last discrepancy a function of the different time periods, or something else? It seems to be something else. I downloaded the replication files from the World Inequality Report, made sure I could perfectly reproduce the main elephant curve above, and then simply changed the start and end dates to limit them to 1988 to 2008 a la Lakner and Milanovic (instead of 1980 to 2016 in the new version). The result is still wildly different from the original elephant.
Figure 2. The original elephant graph
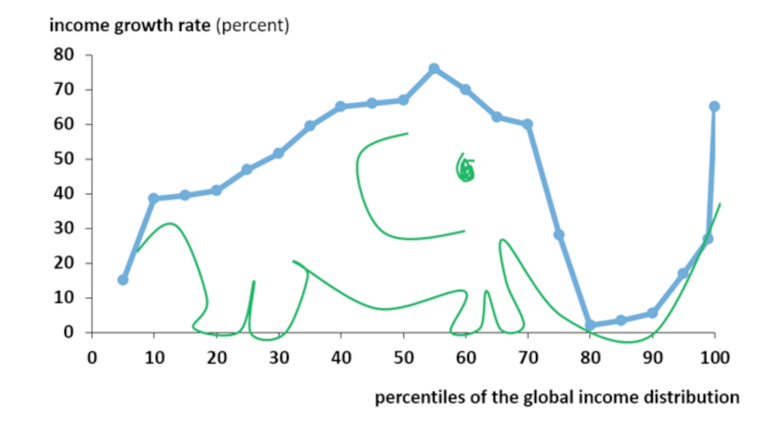
Source: Freund, Caroline. PIIE. Data courtesy of Lakner and Milanovic. World Bank. 2013.
Figure 3. The new elephant graph from the World Inequality Report looks more like the Loch Ness monster.
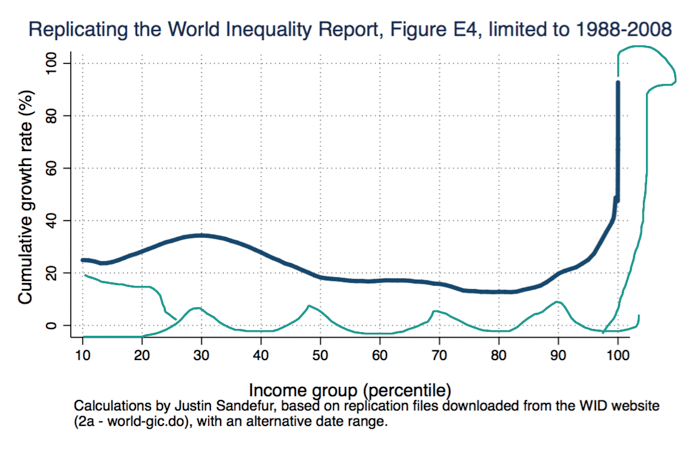
These are very different animals. The elephant has drowned! To be honest, I'm really not sure what's going on.
I suspect much of this discrepancy has to do with methodological differences, particularly in how the WIR team has tried to reconcile survey estimates to economic growth rates from national accounts. But the discrepancies are big and probably demand further explanation, given the inordinate popular attention that the original elephant graph received. A couple basic facts remain robust though: after a period of growing global inequality in the mid-20th century, incomes around the world are now converging with the rise of large developing countries, and—lest we feel too complacent—that equalizing force is partially offset by breakaway growth for a tiny global elite.
Thanks to Facundo Alvaredo and Branko Milanovic for helpful clarifications by email. And kudos to both research teams for posting replication files online. All the interpretations and any errors here in the calculations are obviously mine alone.
Disclaimer
CGD blog posts reflect the views of the authors, drawing on prior research and experience in their areas of expertise. CGD is a nonpartisan, independent organization and does not take institutional positions.