Angus Deaton said he didn’t mind poverty analysis as long as the poverty line is infinity. Stevenson and Wolfers (2013) assemble the array of survey based measures of subjective well- being (SWB), such as “life satisfaction” or “happiness” and search for income satiation. They ask, is there some point in the distribution of income at which there is either (a) “strong satiation”--more income doesn’t produce more subjective well-being, or even (b) “weak satiation”-- increments to well-being become smaller than expected from a simple linear-log relationship. Their answer: No.
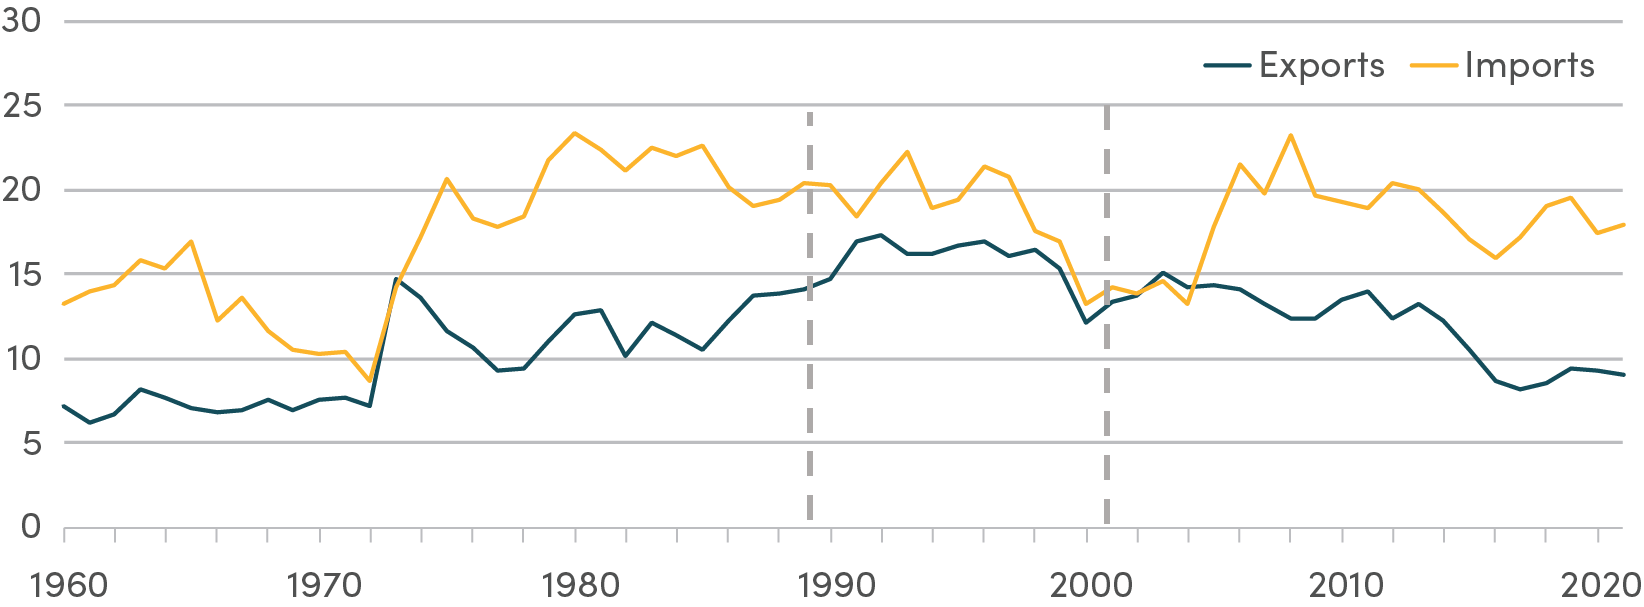
Figure 2 (in their paper) shows the results of country by country non-parametric locally linear (“lowess”) regressions of a standardized life satisfaction measure on income with household data (10th to 90th percentiles graphed).
First, there is no evidence at all that within countries the increments to SWB asymptote to zero at any level of income, or even, for that matter, are linear in log income all the way up. As they put it, there might be a satiation level, but they couldn’t find it: Angus was right; infinity is a good poverty line.
Second, the gain to subjective well-being isn’t more sharply increasing than linear in log income at lower levels of income than at middle or higher levels of income. The low end of the data for many countries (e.g. India, Pakistan, Bangladesh, Indonesia, Nigeria) shows household incomes in the range of $1500, which is in the range of low poverty lines (annual income of $1500 for a family of four would be $1.03 per person per day). In this—as in all other data about objective measures of well-being—there is no line. That is, people get better off by moving from an income level just below a poverty line to income just above a poverty line in exactly the same way as moving from just above a poverty line to a level of income higher than that—and so on and so on.

Source: Stevenson and Wolfers (2013)
If self-reported subjective well-being is linear in log income:

Then the (partial) derivate of subjective well-being to gains in income is:

This implies that if we wanted to assess the relative gain to subjective well-being from an equivalent absolute gain in income of two individuals at different levels of income (call them “low” and “high”) then the ratio is (as the linear coefficient cancels out):

This is simple and intuitive: if the “high” income is five times higher than the “low” income then the absolute gain in subjective well-being from income to the low income person is five times higher than the gain to the high income person.
A quintessential features “poverty” analysis, and I would argue the only feature that distinguishes it from standard welfare economics, is that above the poverty line gains to income count for exactly zero. The formula for the reduction in poverty with any standard (Foster-Greer-Thorbecke) poverty measure results in a formula like:

(What the “some formula” is with different α’s is irrelevant to the fundamental point I wish to make so I am ignoring the complicated, but well known, formulas).
If “poverty” analysis is meant to be a non-paternalistic assessment of human well-being then poverty analysis with low poverty lines gets two important things completely, totally, and irremediably wrong relative to the empirical evidence about well-being.
One well-known and widely remarked upon problem is that standard poverty analysis with low poverty lines places far too much weight relative to empirical evidence from subjective well- being to gains from “below the low poverty line” poor in poor countries versus those just above a low poverty line (what some call the “middle class”) in poor countries.
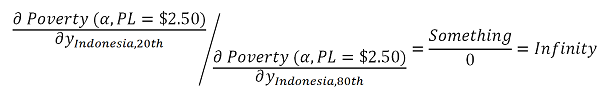
For instance, in the World Bank PovCal database[1] the 20th percentile of consumption expenditures in Indonesia in 2005 PPP$ was $1.32 per person per day whereas the consumption expenditures at the 80th percentile was $3.70 per person per day. How would one normatively evaluate the relative importance of gains at those two levels of consumption?
Say we accepted even the higher of the two commonly used low poverty lines and used a poverty line of $2.50. Then the gains to the 20th percentile in Indonesia are infinitely more important than gains to the 80th percentile[2].
On the other hand, if we use subjective well-being then gains to the 20th percentile are more important than to the 80th percentile, but 2.8 times as important.

Unless you think “infinity” is a reasonable approximation to 2.82 there is a very big problem here. (I have heard there are non-numerate cultures without words for large integers, but I think all people(s) can distinguish “less than 3” from “infinitely large”).
There is a second very big problem with low poverty lines, one less remarked upon. The use of low poverty lines dramatically understates the importance of gains to the “middle class” of poor countries relative to the “poor” of rich countries relative to the empirical evidence about subjective well-being.
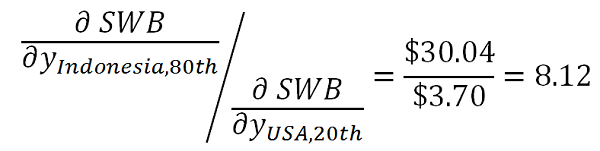
For instance, suppose we compare the normative evaluation of the gains to the 80th percentile in Indonesia to the average of the bottom quintile in consumption expenditures in the USA[3]. In the USA the per person consumption spending in the bottom quintile in 2012 (in 2005 prices) was $30.04. This implies the income gain to a “middle income” (80th percentile) person in Indonesia brings about 8 times as much SWB gain as the same income gain to “the poor” in the USA.
But what about poverty analysis? In this case both are above either “dollar a day” or “two dollars a day” low poverty lines so the poverty reduction benefit of income gains to either is the same: zero. Poverty analysis is indifferent to gains to either the Indonesian middle class or the USA poor—neither count at all.
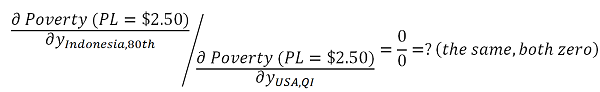
Figure 1 shows both problems of the difference between poverty analysis and well-being that is linear in log income using the Indonesian example with a global poverty line of $2.50.
The first problem is that a small gap in consumption expenditures between the 20th and 80th percentiles (a difference of only $2.39 per day) still implies that gains to “the poor” are given infinitely more weight than gains to the 80th percentile. So a small gap in incomes/consumption becomes a big gap in normative evaluation.
The second problem is that the enormously larger gap between the Indonesian 80th percentile and the USA bottom quintile—a gap of $26.33 per day, more than ten times the 80th-20th gap within Indonesia—gets zero weight. Log-linearity implies income gains are 8.11 times more important to SWB for 80th percentile Indonesians than “the poor” in the USA. Yet poverty analysis says both get the same weight in normative evaluation: zero. So a big gap in income becomes a small (in fact, no gap) in normative evaluation.

So, to take “poverty” as a normative objective one has to believe both that “infinity” is about the same as 2.8 (small gaps are big gaps) and 8 is “about the same” as equality (big gaps are no gaps).
(This graph for Indonesia is not just a carefully chosen example—in nearly every large developing country the income gains to the “middle class” (either as the 60th or 80th percentile) don’t matter to “poverty” as they are above “extreme poverty” line. Documents with this same graph for every country (using either PL=$1.25 and PL=$2.50) are available here and here).
One could just get rid of poverty lines altogether in favor of many other methods of normative evaluation that take into account inequality of income but don’t have these obvious defects (e.g. inequality aversion adjusted “equivalent income”) or shift to indicators that capture “inclusive growth” like the median (Birdsall and Meyer 2014). If this is too radical and organizationally difficult for those who are committed to the rhetoric of “poverty” then one could simply stop using low poverty lines and use high poverty lines—like “ten dollars a day” (which I have argued for earlier) or “fifteen dollars a day”. At these poverty lines the twin problems of poverty lines are at least mitigated.
The sooner the development community, both academics and practitioners, can wean themselves off the use of “low bar” poverty lines the better everyone—including, as I have argued, “the poor” themselves—will be. Unfortunately, the global donor politics seems to pushing for more, rather than less, attention on “extreme poverty” as opposed to “inclusive growth.” (A recent seminar invitation from the head of USAID claims “As political momentum builds to make the end of extreme poverty central to the post-2015 Development Agenda…”). The question of why something so at odds with empirical evidence about well-being makes such good international donor politics is a story for another day.
[1] This is not a complaint about the “bang-bang” properties of the head-count measure (which might be a “straw man” as it can be fixed with higher α so that the function of poverty wrt to income is continuous but kinked) but about the first derivative of poverty w.r.t to consumption/income and this holds true for all α (in the FGT measure) and is an unavoidable mathematical consequence of a finite poverty line.
[2] All the estimates of the income/consumption at various percentiles of distributions come from the recent paper Dykstra, Dykstra and Sandefur (2014).
[3] This is not apples to apples as I am comparing the percentiles in developing countries (e.g. 40th, 60th, 80th) to the average of zero to 20th percentiles (which, due to non-linearity, is something above the 10th but below the 20th percentile) so this is not “80th in Indonesia to 20th in USA” but
Disclaimer
CGD blog posts reflect the views of the authors, drawing on prior research and experience in their areas of expertise. CGD is a nonpartisan, independent organization and does not take institutional positions.